Fractals_T
Indicator

Fractals_T

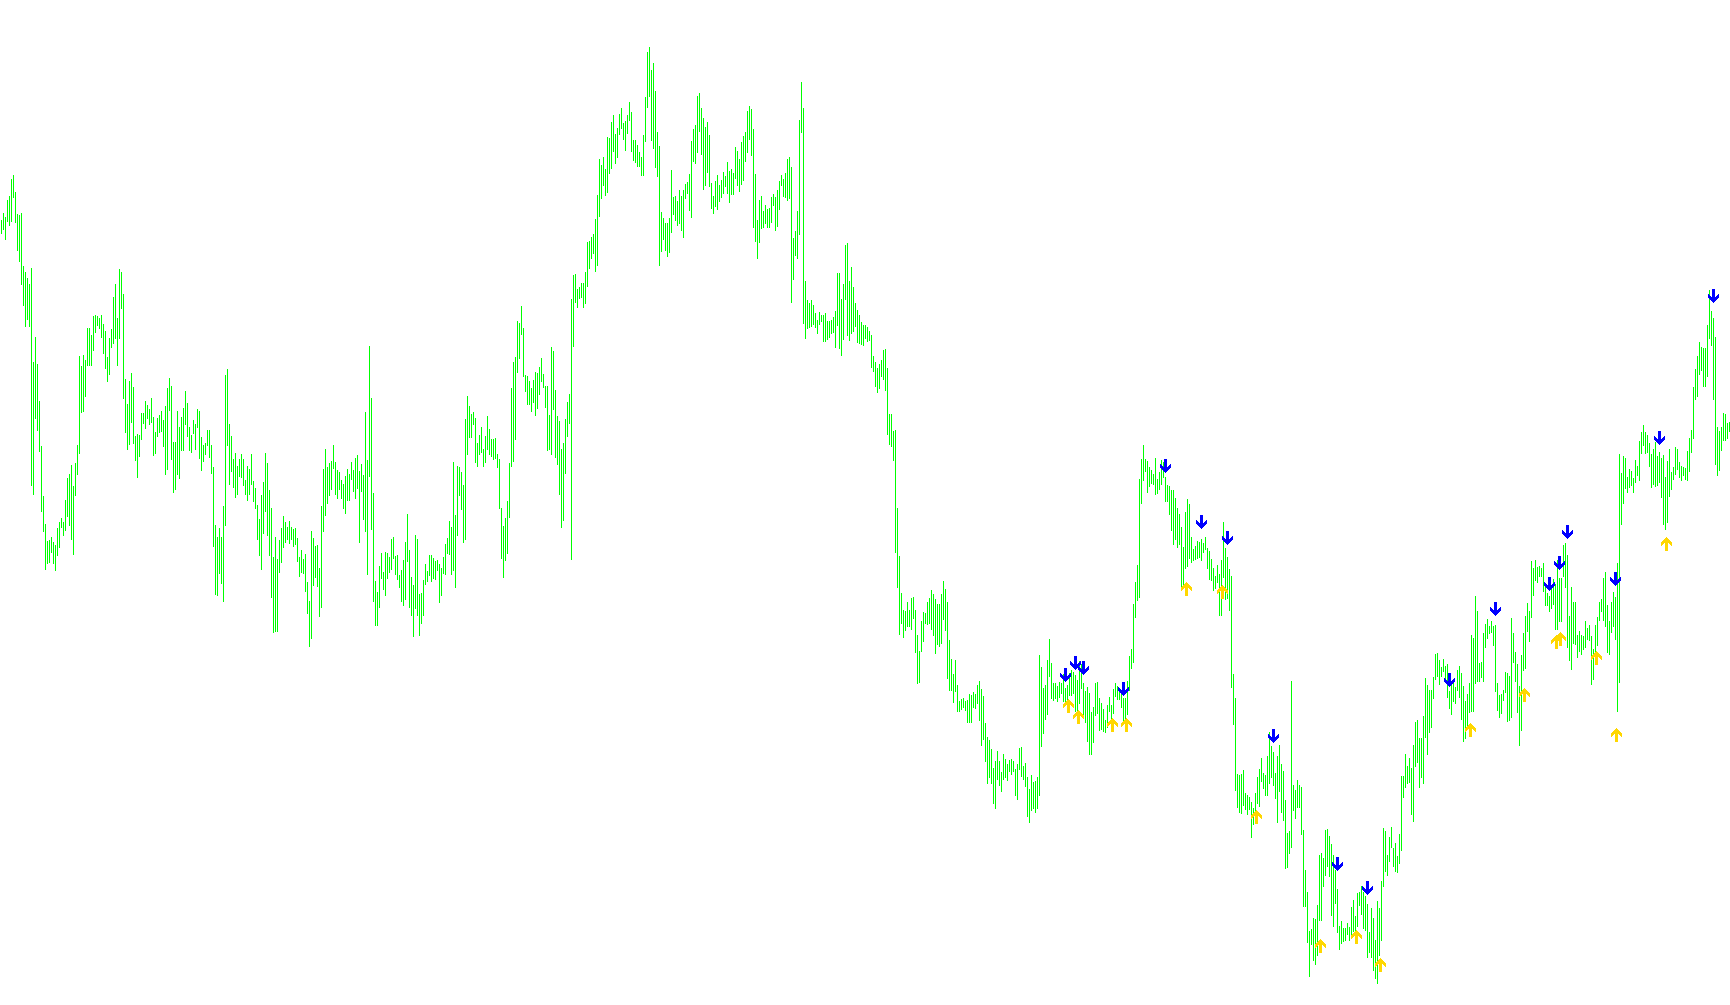
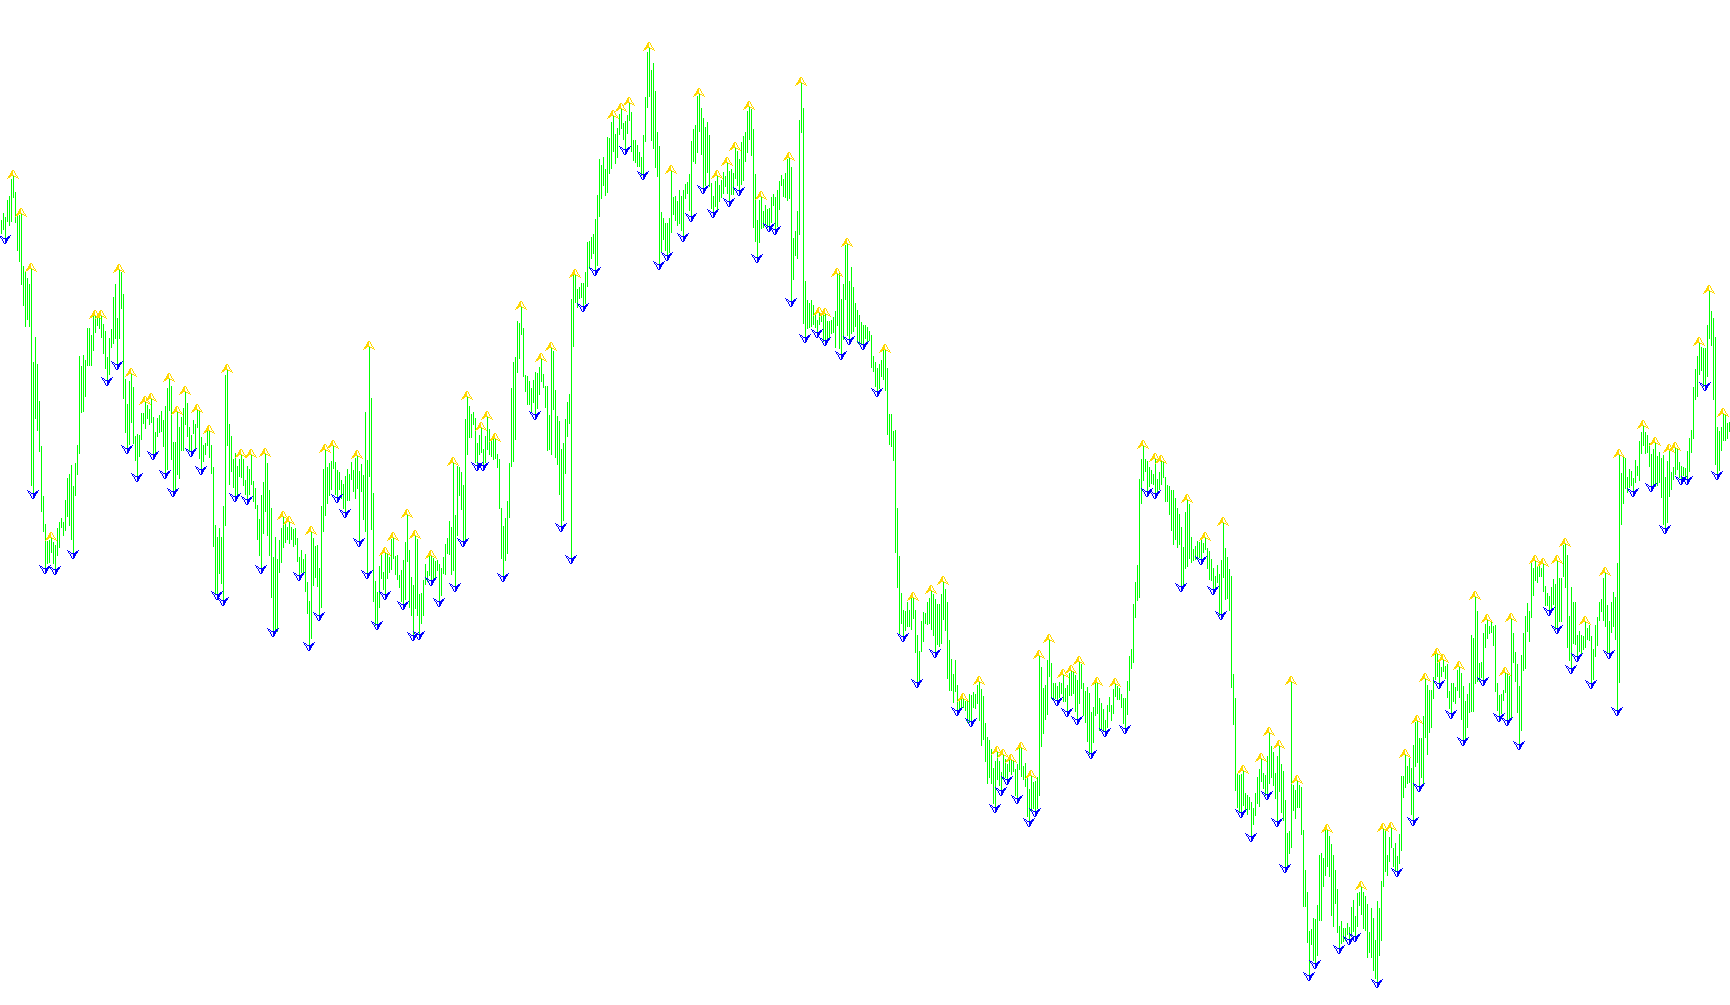
The algorithm detects local price extrema by comparing current highs and lows against a 5-to-9 bar neighborhood to identify structural reversal points.

Indicator

fractals_Takbir

Indicator

fractals_Takbir_m

Fractals_v1
Indicator

Fractals_v1

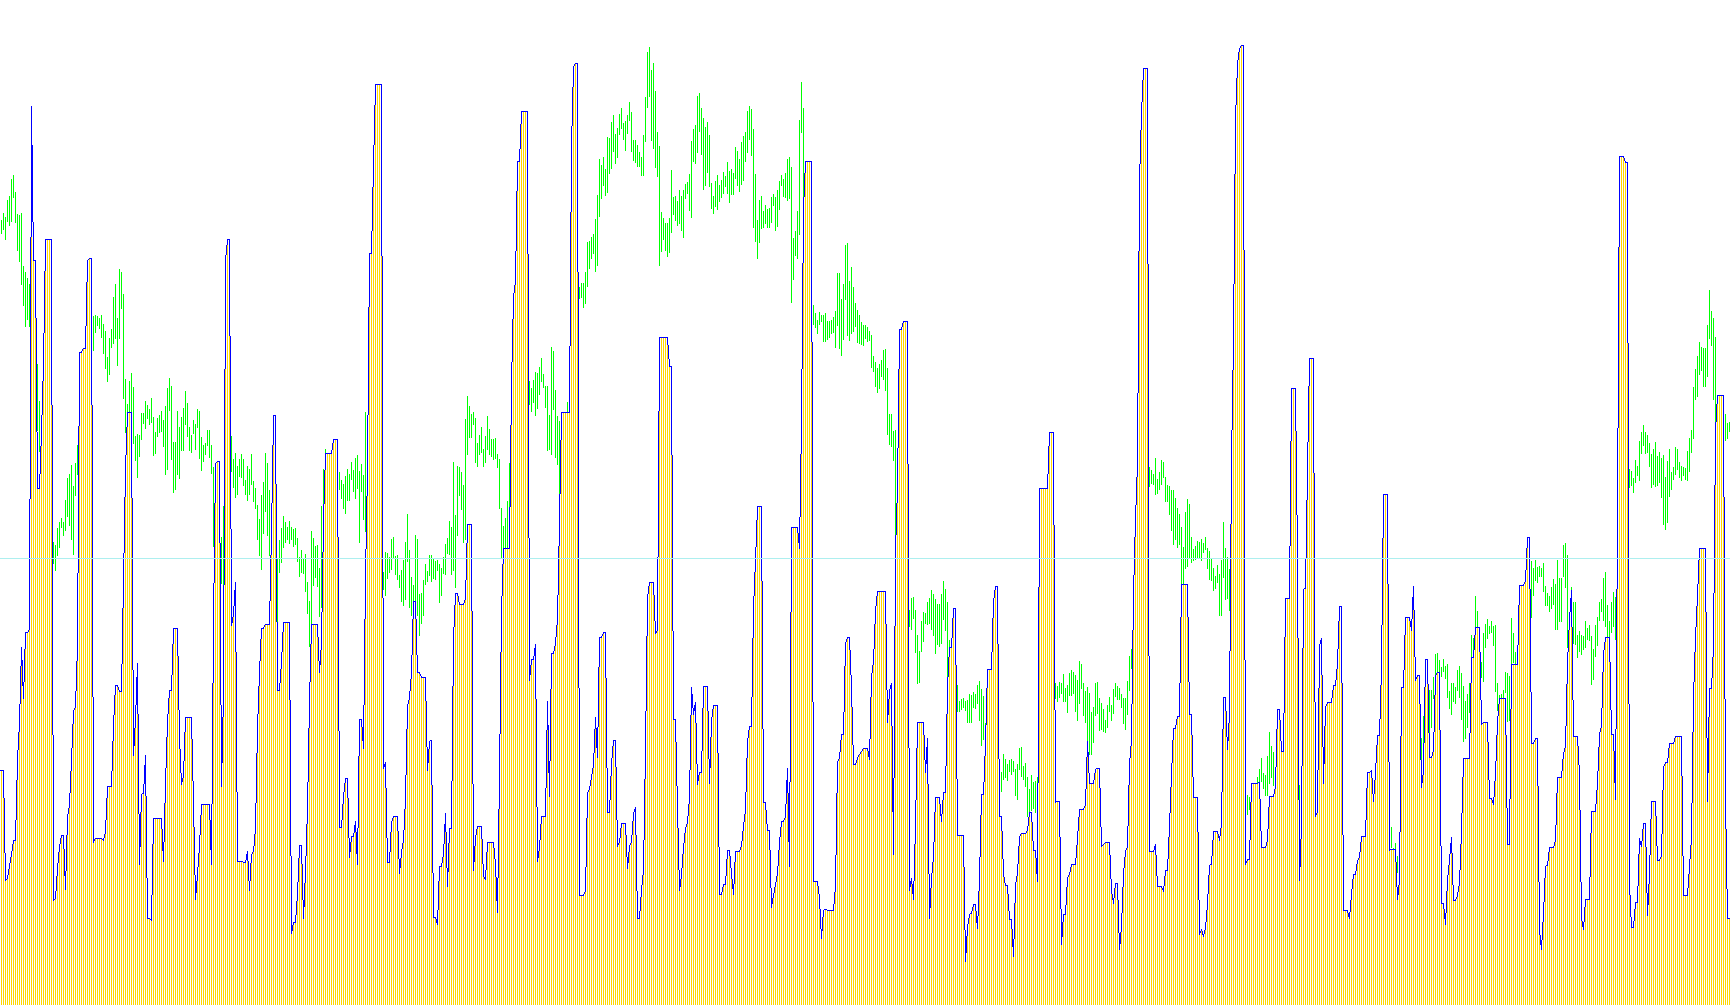
This indicator identifies local price extrema by scanning for five-to-nine bar geometric configurations where a central high or low point exceeds its immediate neighbors.

Fractaluri
Indicator

Fractaluri

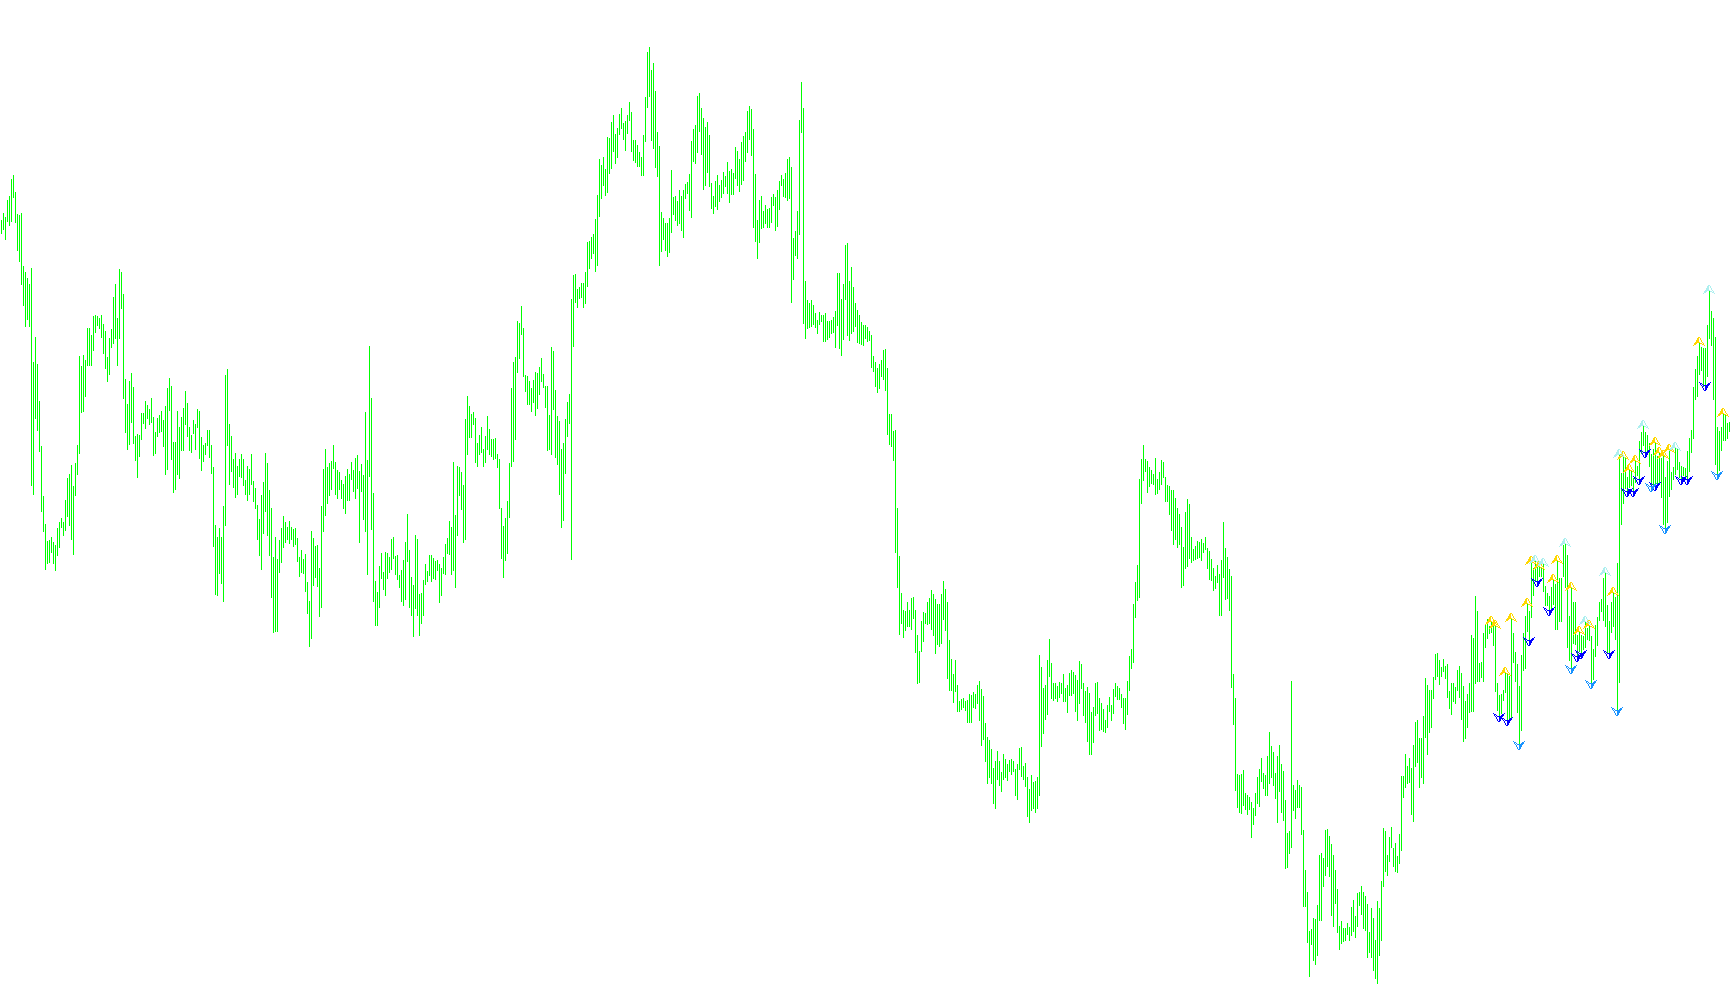
Identifies trend reversals by monitoring price penetration beyond a volatility-adjusted dynamic range derived from historical highs and lows.

FractalVolOpt
Indicator

FractalVolOpt

This indicator identifies local price extremes by validating structural peak/trough formation against surrounding candle highs, lows, and volume distribution gradients.

FractalVolty_v1
Indicator

FractalVolty_v1

iMAOnArray

This indicator identifies local price extremes using fractal structures to calculate a volatility range, which is then smoothed and averaged to provide trend-based trigger signals.

Indicator

fractalz

fractal_2lev
Indicator

fractal_2lev

This indicator identifies multi-layered swing points by recursively filtering primary fractal peaks and valleys to highlight significant secondary structural extrema.

Indicator

fractal_bands

iMA
Indicator

Fractal_channels_milko

iFractals
Indicator

fractal_dimension

Indicator

fractal_dimension_v1

Fractal_Level_Xrust
Indicator

Fractal_Level_Xrust

iFractals
Fractal_Level_Xrust[1]
Indicator

Fractal_Level_Xrust[1]

iFractals
Fractal_Level_Xrust_V2
Indicator

Fractal_Level_Xrust_V2

iFractals
Indicator

fractional_bands

iMA
fract_sFractals_alert
Indicator

fract_sFractals_alert

Identifies local price extremes by scanning multiple historical candle configurations to detect multi-bar pivot points and structural reversals.

fract_TFractal[1]
Indicator

fract_TFractal[1]

The algorithm identifies significant price structural pivot points by scanning for local extrema across expanding multi-bar windows of five to nine consecutive candles.

FRAMA
Indicator

FRAMA

This indicator dynamically adjusts its smoothing coefficient by calculating the fractal dimension of price volatility to filter market noise while preserving trend integrity.

FRAMA_Bands
Indicator

FRAMA_Bands

This indicator calculates volatility-adjusted boundaries by applying an exponential smoothing algorithm to a self-adapting fractal moving average derived from logarithmic price range differentials.

Frank_ud- add mody
Indicator

Frank_ud- add mody

This algorithm executes a high-intensity trade management strategy that dynamically scales lot sizes based on existing position volume while monitoring margin safety and relative profit thresholds for automated position liquidation.

Indicator

FRASMA

iMA
Indicator

FRASMA_v2

iMA
Freeway - All
Indicator

Freeway - All

iCCI

This indicator monitors simultaneous positive or negative Commodity Channel Index (CCI) alignments across four distinct timeframes to identify synchronized directional trends for multiple currency pairs.

Freeway - All1
Indicator

Freeway - All1

iCCI

This indicator monitors multiple currency pairs to identify synchronized bullish or bearish momentum by verifying that the Commodity Channel Index (CCI) maintains a consistent polarity across M15, M30, H1, and H4 timeframes.

Freeway - All1_v1
Indicator

Freeway - All1_v1

iCCI

This indicator monitors multiple currency pairs simultaneously to identify high-probability trend alignments by detecting synchronized positive or negative Commodity Channel Index (CCI) values across four distinct timeframes.

Freeway - All_v1
Indicator

Freeway - All_v1

iCCI

This indicator scans multiple currency pairs across M15, M30, H1, and H4 timeframes to identify synchronized bullish or bearish momentum using the Commodity Channel Index.

fromRepOnGraph
Indicator

fromRepOnGraph

This script parses historical trade data from a standard Strategy Tester report file to dynamically plot execution entries, exits, and profit/loss results as graphical rectangles or lines on the MT4 chart.

Fruity Pebbles 1.1
Indicator

Fruity Pebbles 1.1

iMACDiMA

This indicator identifies trend reversals by detecting specific momentum crossovers in the MACD differential while confirming price action alignment with Exponential Moving Average dynamics.

Fruity Pebbles 1.1_v1
Indicator

Fruity Pebbles 1.1_v1

iMACDiMA

This indicator identifies potential reversal points by detecting momentum shifts in the MACD histogram relative to exponential moving average trend persistence.

FTLM-STLM
Indicator

FTLM-STLM

The logic calculates two distinct synthetic trend lines using complex linear combinations of historical closing prices across varying weighted lookback windows.

FTLM-STLM_MTF
Indicator

FTLM-STLM_MTF

This indicator overlays historical trend data from a higher timeframe onto the current chart to facilitate cross-period momentum alignment.
FTLM-STLM_v1
Indicator

FTLM-STLM_v1

This indicator calculates two distinct smoothed price series using complex fixed-coefficient linear regressions to identify momentum divergence and trend shifts.

FTLM-STLM_v2
Indicator

FTLM-STLM_v2

This indicator utilizes four distinct high-order weighted moving average regressions to calculate the divergence between long-term price momentum and short-term volatility shifts.

FTLM-STLM_v3
Indicator

FTLM-STLM_v3

This indicator utilizes four distinct weighted linear combinations of historical closing prices to calculate and visualize dual momentum shifts.

FTLM
Indicator

FTLM

This indicator employs a multi-coefficient linear combination of historical price data to isolate directional momentum through differential signal processing.

FTLM_001
Indicator

FTLM_001

This indicator calculates two distinct multi-period price momentum signals by applying specific weighted coefficients to historical closing prices and measuring the differential between their respective results.

FTLM_hist
Indicator

FTLM_hist

This indicator calculates and compares two distinct weighted moving averages based on 44-period price coefficients to identify directional momentum shifts via a histogram.

FTLM_hist_v1
Indicator

FTLM_hist_v1

This indicator utilizes a dual-layered linear regression approach to compare weighted price momentum across 48-bar lookback windows, visualizing directional shifts through histogram divergence.

FTLM_hist_v2
Indicator

FTLM_hist_v2

This indicator calculates momentum by subtracting a secondary multi-coefficient weighted average from a primary 44-period weighted price matrix to identify trend direction.

FTLM_KG_hist
Indicator

FTLM_KG_hist

This indicator calculates the variance between two distinct weighted moving average sums to identify directional momentum shifts.

FTLM_KG_hist_v1
Indicator

FTLM_KG_hist_v1

This indicator calculates the delta between two multi-layered, kernel-weighted linear combinations of price data to identify directional momentum shifts.

FTLM_STLM
Indicator

FTLM_STLM

This indicator calculates and visualizes the differential between two multi-coefficient weighted price models to highlight underlying momentum shifts.

FTLM_STLM_v1
Indicator

FTLM_STLM_v1

This indicator utilizes multiple distinct weighted linear regressions over a 90-bar period to calculate price momentum shifts through differential smoothing.

FullFiboPiv_Weekly_DK
Indicator

FullFiboPiv_Weekly_DK

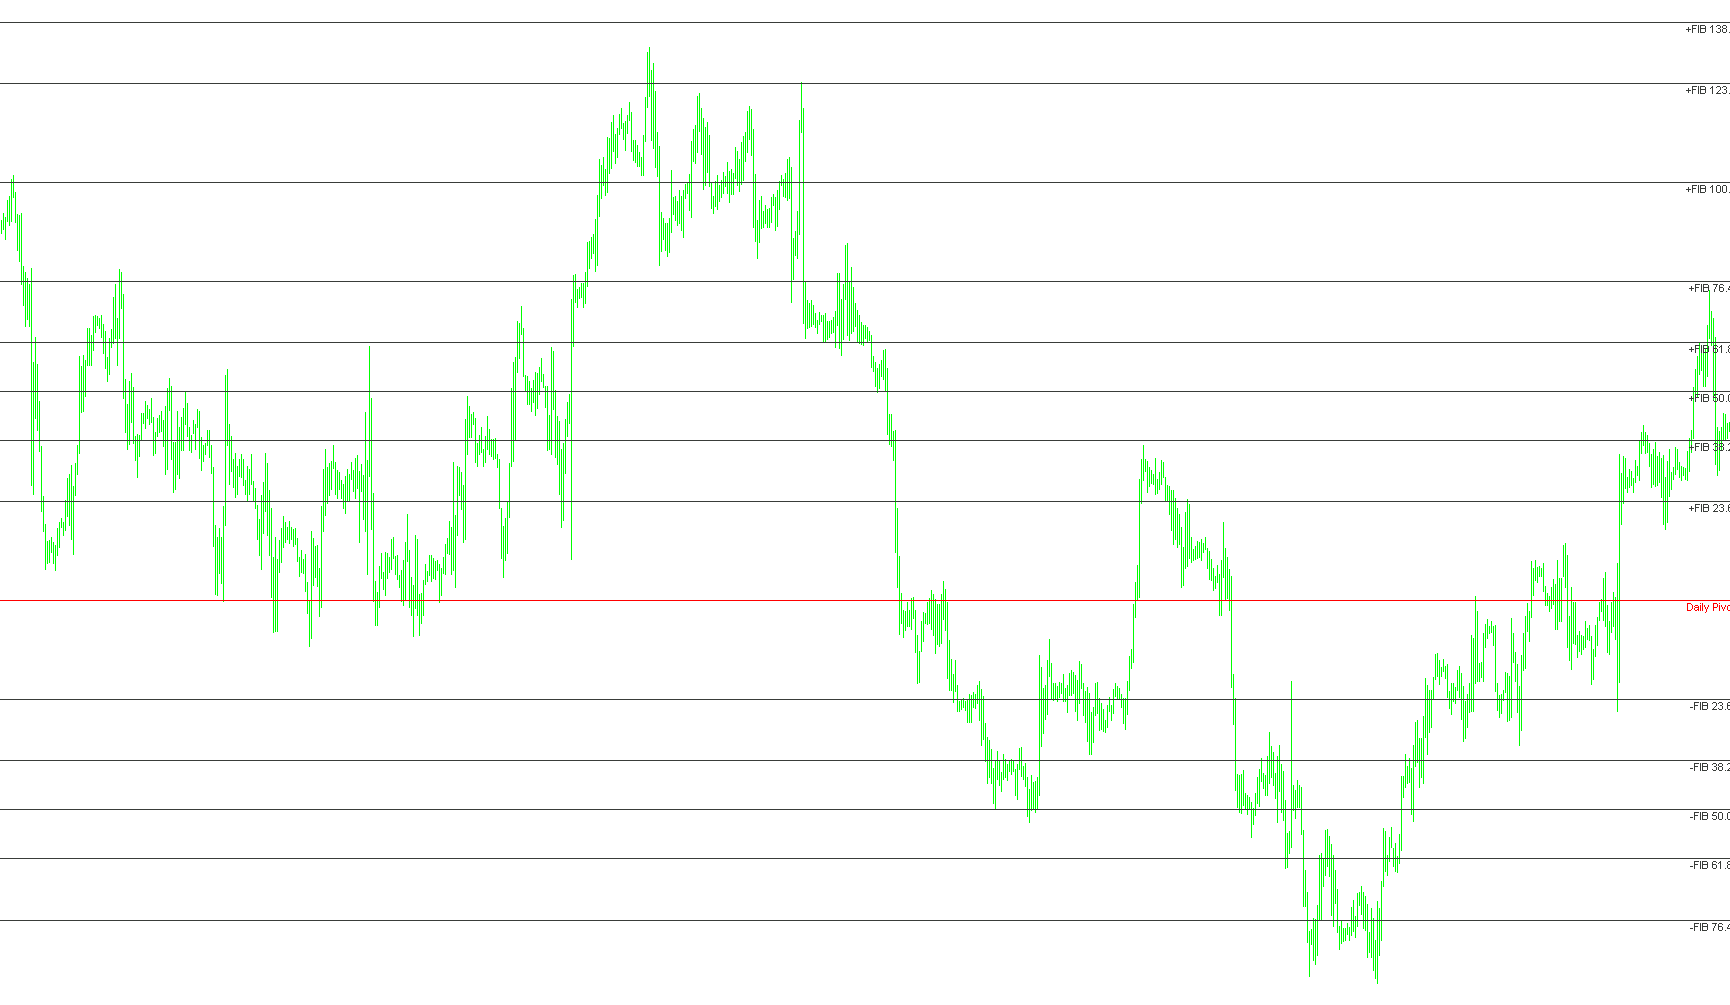
This indicator synthesizes weekly high, low, and close data to project a comprehensive grid of standard pivot levels integrated with expanded Fibonacci retracement zones.

Full_Bar_w_Spread_Shadow
Indicator

Full_Bar_w_Spread_Shadow

This indicator calculates and visualizes price distribution by mapping the interplay between high/low extremes and the real-time bid-ask spread relative to closing prices.

Full_Bar_w_Spread_Shadow_v1
Indicator

Full_Bar_w_Spread_Shadow_v1

This indicator visualizes price action by calculating real-time bid-ask spreads to project upper boundaries and split price levels on every bar.

Full_Bar_w_Spread_Shadow_v2
Indicator

Full_Bar_w_Spread_Shadow_v2

This indicator projects real-time liquidity gaps by calculating the price variance between high, close, and spread metrics to visualize potential execution boundaries.

Full_Bar_w_Spread_Shadow_v3
Indicator

Full_Bar_w_Spread_Shadow_v3

This indicator dynamically maps price action by integrating real-time bid-ask spreads into the identification of high, low, and closing equilibrium points to visualize liquidity boundaries.