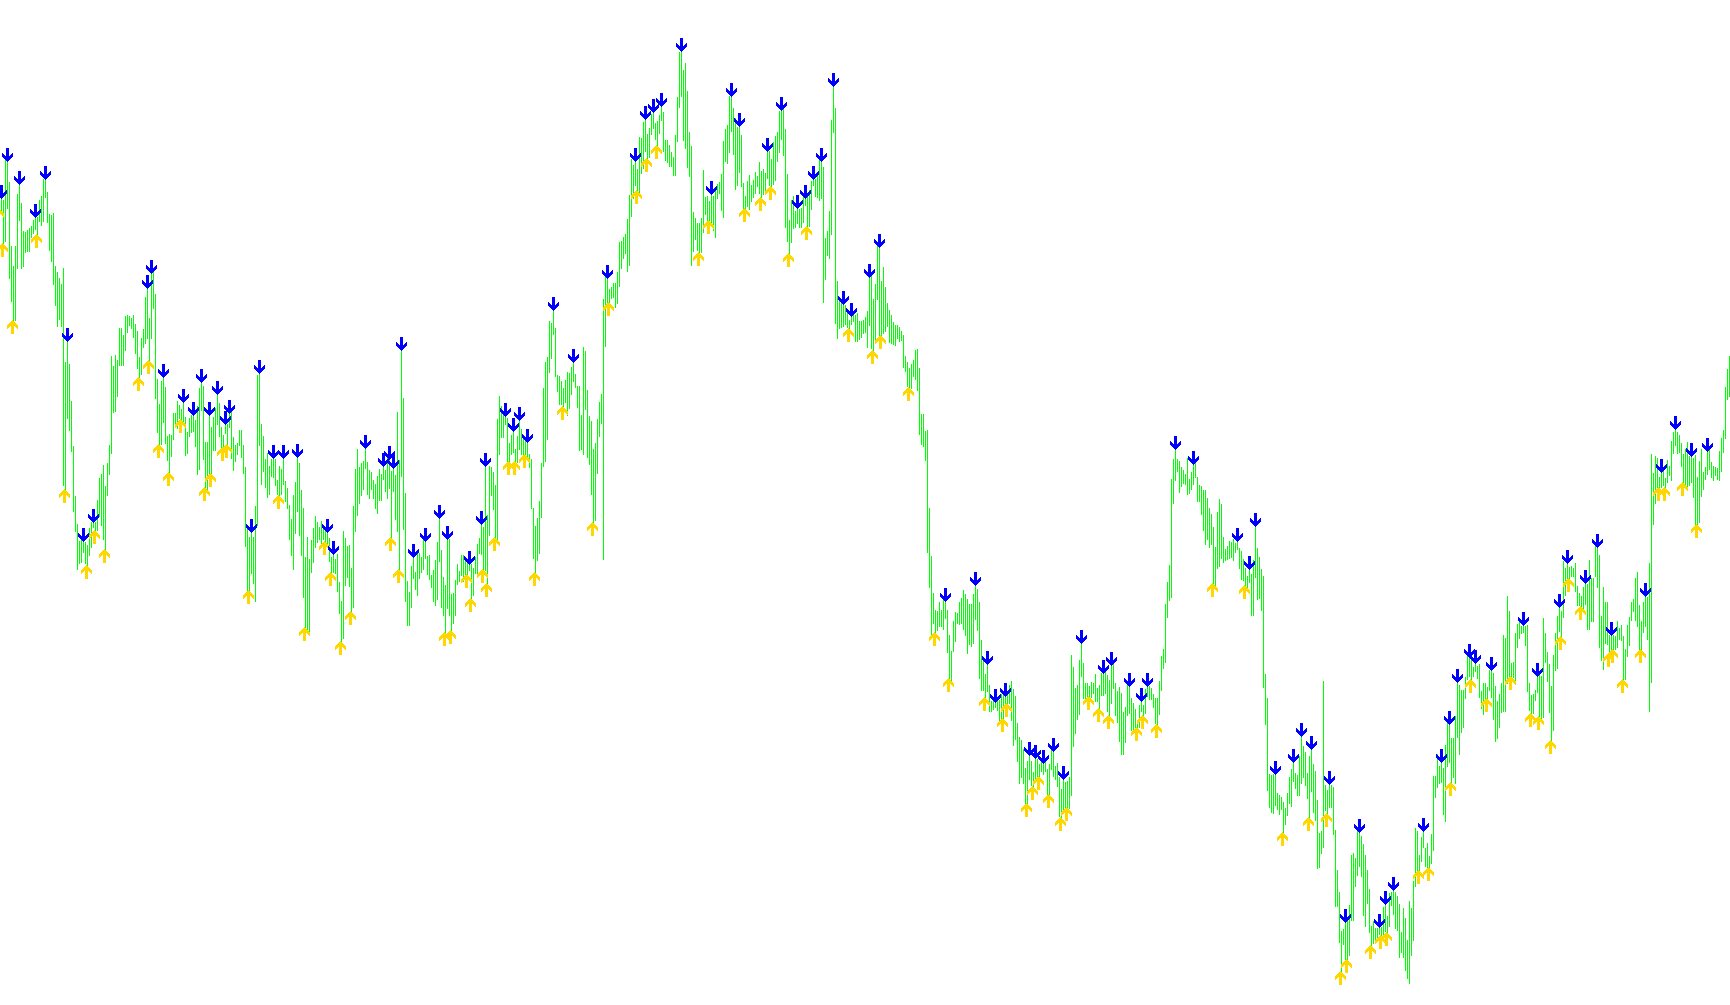
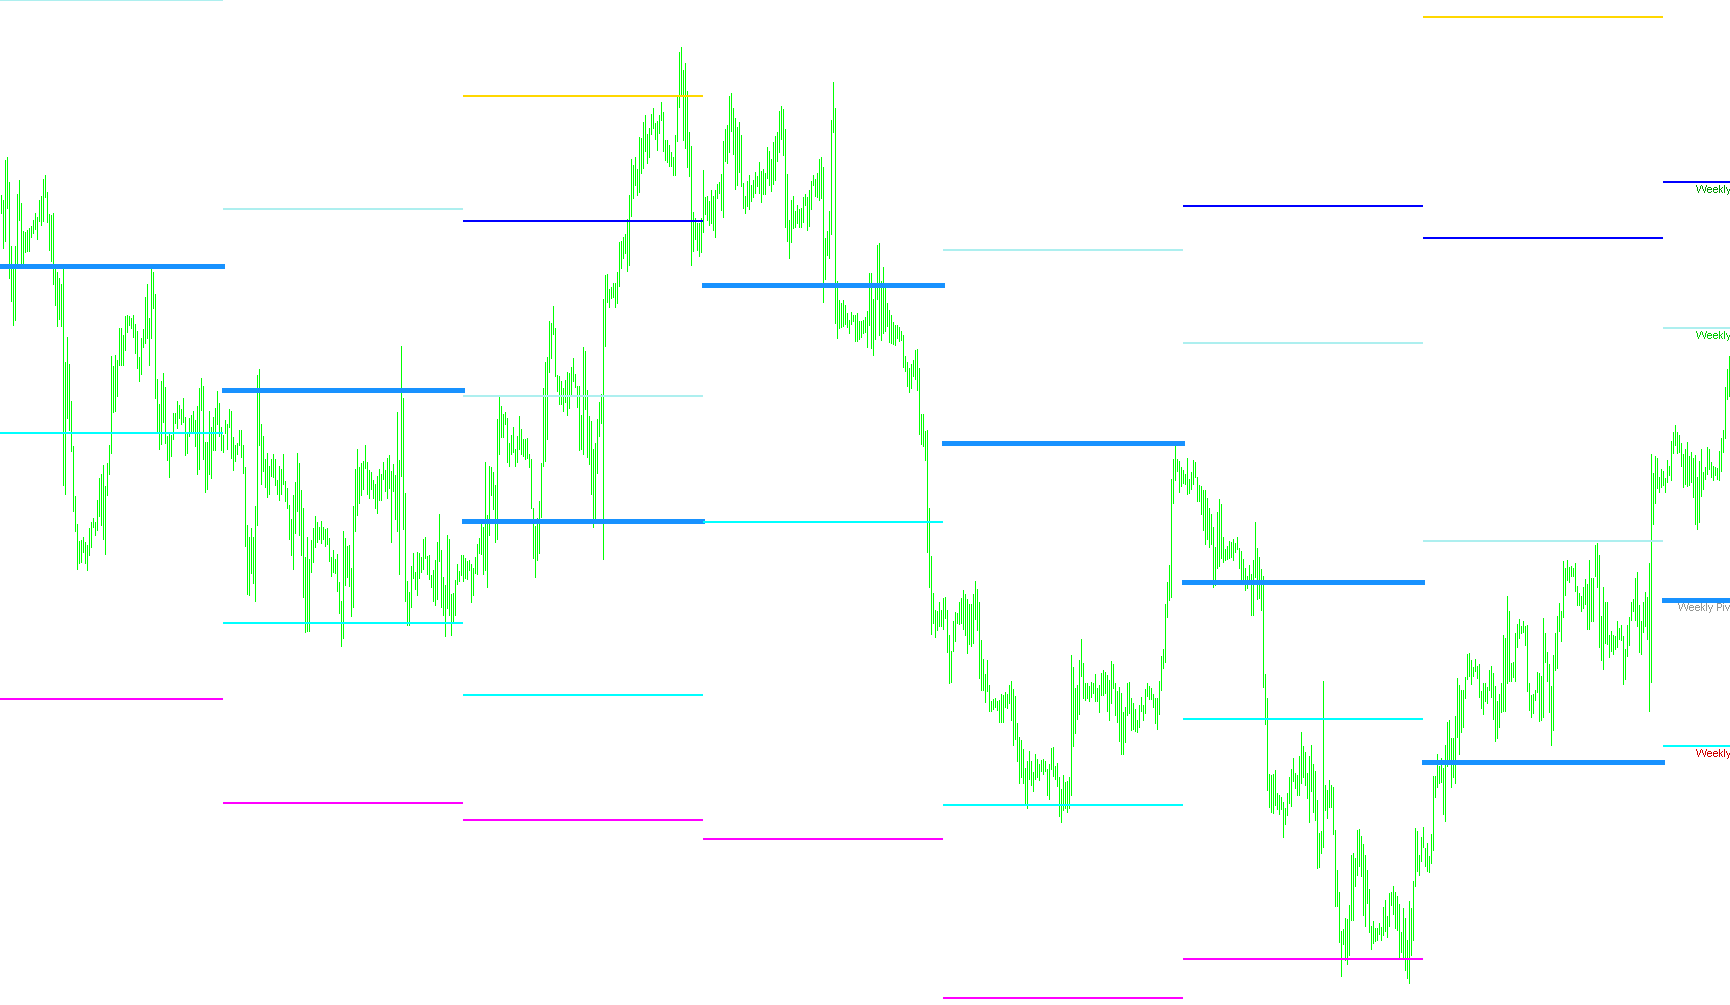
FlatTrend_V2
Indicator

FlatTrend_V2

iADXiSAR

This indicator identifies directional shifts by correlating Parabolic SAR price position with ADX trend strength dynamics to visualize bullish and bearish momentum states.

FLATTR~2 (2)
Indicator

FLATTR~2 (2)

iMACD

This indicator visualizes market equilibrium by identifying periods where the MACD main line remains inactive, contrasted against bullish and bearish momentum shifts.

Flat_Trend
Indicator

Flat_Trend

iADXiSAR

This indicator identifies directional bias by correlating Parabolic SAR price crossovers with ADX trend strength shifts across multi-timeframe analysis.

Flat_Trend_MOM
Indicator

Flat_Trend_MOM

iMomentum

This indicator visualizes market polarity by mapping momentum values above or below the 100-level baseline into distinct bullish and bearish histogram zones.

Flat_Trend_RSI
Indicator

Flat_Trend_RSI

iRSI

This indicator visualizes trend strength by identifying extreme RSI crossovers and filtering bullish or bearish signals based on specific momentum corridor boundaries.

Flat_v1
Indicator

Flat_v1

iStdDev

This indicator calculates a normalized percentage value based on the standard deviation of price fluctuations relative to its high and low extremes over a specific look-back period.

Flat_v2
Indicator

Flat_v2

iStdDev

This indicator normalizes the square root of mean absolute deviations from a moving average into a percentage scale to identify relative volatility extremes.

Flexi_bars_swing_v2
Indicator

Flexi_bars_swing_v2

This indicator detects structural market extrema by validating multi-candle price pivots to generate proactive buy and sell signal markers.

Indicator

FLOAT#Data

Indicator

FLOAT#Data_2

Indicator

Float(2)

Indicator

Float

FloatPivot
Indicator

FloatPivot

The algorithm synthesizes high-low extremes with a three-bar price mean to establish a central pivot and derive symmetric deviation boundaries.

Indicator

Float[1]

Indicator

Float_001

Indicator

Float_002

Indicator

Float_005

Indicator

Float_01

Indicator

FLOAT_Data_2

Indicator

Float_email

Indicator

Float_v1

Indicator

Float_v2

Indicator

Float_v3

Floor_Pivots_Daily
Indicator

Floor_Pivots_Daily

This indicator calculates and plots multi-level Fibonacci-style pivot points based on a user-defined price range, identifying key structural support and resistance zones for intra-day trading.

Floor_Pivots_Daily_Mid
Indicator

Floor_Pivots_Daily_Mid

This indicator calculates and plots specific arithmetic midpoints between primary pivot levels and range boundaries to identify high-precision liquidity zones.

Floor_Pivots_Minutes
Indicator

Floor_Pivots_Minutes

This indicator calculates multi-level pivot points and support/resistance zones based on normalized high, low, and close prices derived from specific historical timeframes.

Floor_Pivots_MTF
Indicator

Floor_Pivots_MTF

This indicator calculates and projects historical price levels by synthesizing high, low, and closing data into primary pivots, range boundaries, and granular mid-resistance/support tiers.

Floor_Pivots_Session
Indicator

Floor_Pivots_Session

This indicator identifies and maps floor pivots and support/resistance levels by calculating price extremes across distinct global trading sessions (Asian, European, and American).

Floor_Pivots_Weekly
Indicator

Floor_Pivots_Weekly

This indicator calculates and plots weekly pivot levels by synthesizing previous week's high, low, and close prices to establish primary support and resistance zones.

Floor_Pivots_Weekly_Mid
Indicator

Floor_Pivots_Weekly_Mid

This indicator calculates and plots intermediate price levels by identifying the arithmetic midpoints between standard weekly pivot points, resistance zones, and support boundaries.

FLOW
Indicator

FLOW

iMomentumOnArray

This indicator calculates a weighted range-based volatility step to generate momentum oscillators and signal lines based on price deviations from multi-layered threshold boundaries.

FLOW_A
Indicator

FLOW_A

iMomentumOnArray

This indicator calculates a multi-tiered momentum signal by analyzing price volatility steps and converting the variance between tiered stochastic levels into a normalized histogram.

Indicator

FN Diver Osc

iMAiMAOnArrayiStdDev
FN Signal
Indicator

FN Signal

iMAiMAOnArrayiStdDev

This indicator quantifies price velocity by applying a logarithmic transformation to standardized deviation residuals, then utilizes dual EMA crossovers on the resulting signal to identify trend reversals.

FN Signal_v2
Indicator

FN Signal_v2

iMAiMAOnArrayiStdDev

This indicator transforms price action into a momentum signal by calculating the log-ratio of normalized price deviations relative to moving averages.

FNCD
Indicator

FNCD

iMAiMAOnArrayiStdDev

The indicator calculates a normalized price deviation from the moving average using standard deviation, transforms it via a logarithmic Fisher function to accentuate momentum extremes, and applies dual exponential moving averages for trend smoothing.

FN_Signal
Indicator

FN_Signal

iMAiMAOnArrayiStdDev

This indicator calculates a normalized price deviation from the mean, applies a logarithmic transformation to dampen extremes, and utilizes dual EMA crossovers for trend momentum detection.

Force Index
Indicator

Force Index

iMA

This indicator quantifies market aggression by multiplying the current volume by the rate of change in moving average price deviations.

Force Index_v1M2LA_mtf
Indicator

Force Index_v1M2LA_mtf

iMA

This indicator quantifies market pressure by calculating the product of trading volume and moving average price differentials across multiple timeframes to identify significant momentum breakouts.

Force Index_v1M2L_mtf
Indicator

Force Index_v1M2L_mtf

iMA

This indicator quantifies price velocity by calculating the product of volume and moving average differences across selectable higher timeframes to detect momentum shifts.

Force_Index
Indicator

Force_Index

iMA

This indicator quantifies market aggression by calculating the product of current trading volume and the rate of change in moving average price variance.

forecast osc-30M
Indicator

forecast osc-30M

This indicator calculates a weighted trajectory of price deviations using a custom regression formula and a triple-smoothed forecasting model to identify momentum reversal points.

forecast osc-30M_v1
Indicator

forecast osc-30M_v1

This indicator calculates a weighted forecasting oscillator by applying a triple smoothing filter to the variance between current prices and a regression-based moving average.

forecast osc
Indicator

forecast osc

This indicator computes a forecasting oscillator by calculating the percentage deviation of current prices from a weighted trendline, smoothed through a T3 triple exponential moving average filter.

ForecastOscillator
Indicator

ForecastOscillator

The algorithm calculates a weighted trend variance by comparing current price deviations against a regression-based weighted average to project momentum shifts.

ForecastOscillator_v1
Indicator

ForecastOscillator_v1

This indicator calculates a weighted trend divergence by comparing current closing prices against a regression-based Weighted Trend (WT) and smoothing the resulting forecast via a triple-smoothed (T3) recursive algorithm.

forecast_osc-30M
Indicator

forecast_osc-30M

This indicator calculates a weighted trend projection by applying triple smoothing coefficients to a price-to-weighted-average ratio.

Forex Alert System
Indicator

Forex Alert System

iADX

Identifies trend reversal points by detecting instantaneous momentum crossovers between the positive and negative directional indicators.

Forex Alert SystemPlus
Indicator

Forex Alert SystemPlus

iADX

This indicator identifies trend reversal points by detecting instances where the Plus DI and Minus DI lines cross each other in real-time.

Indicator

Forex Freeway

iCCIiMA