DynamicZoneStoch
Indicator

DynamicZoneStoch

iStochastic

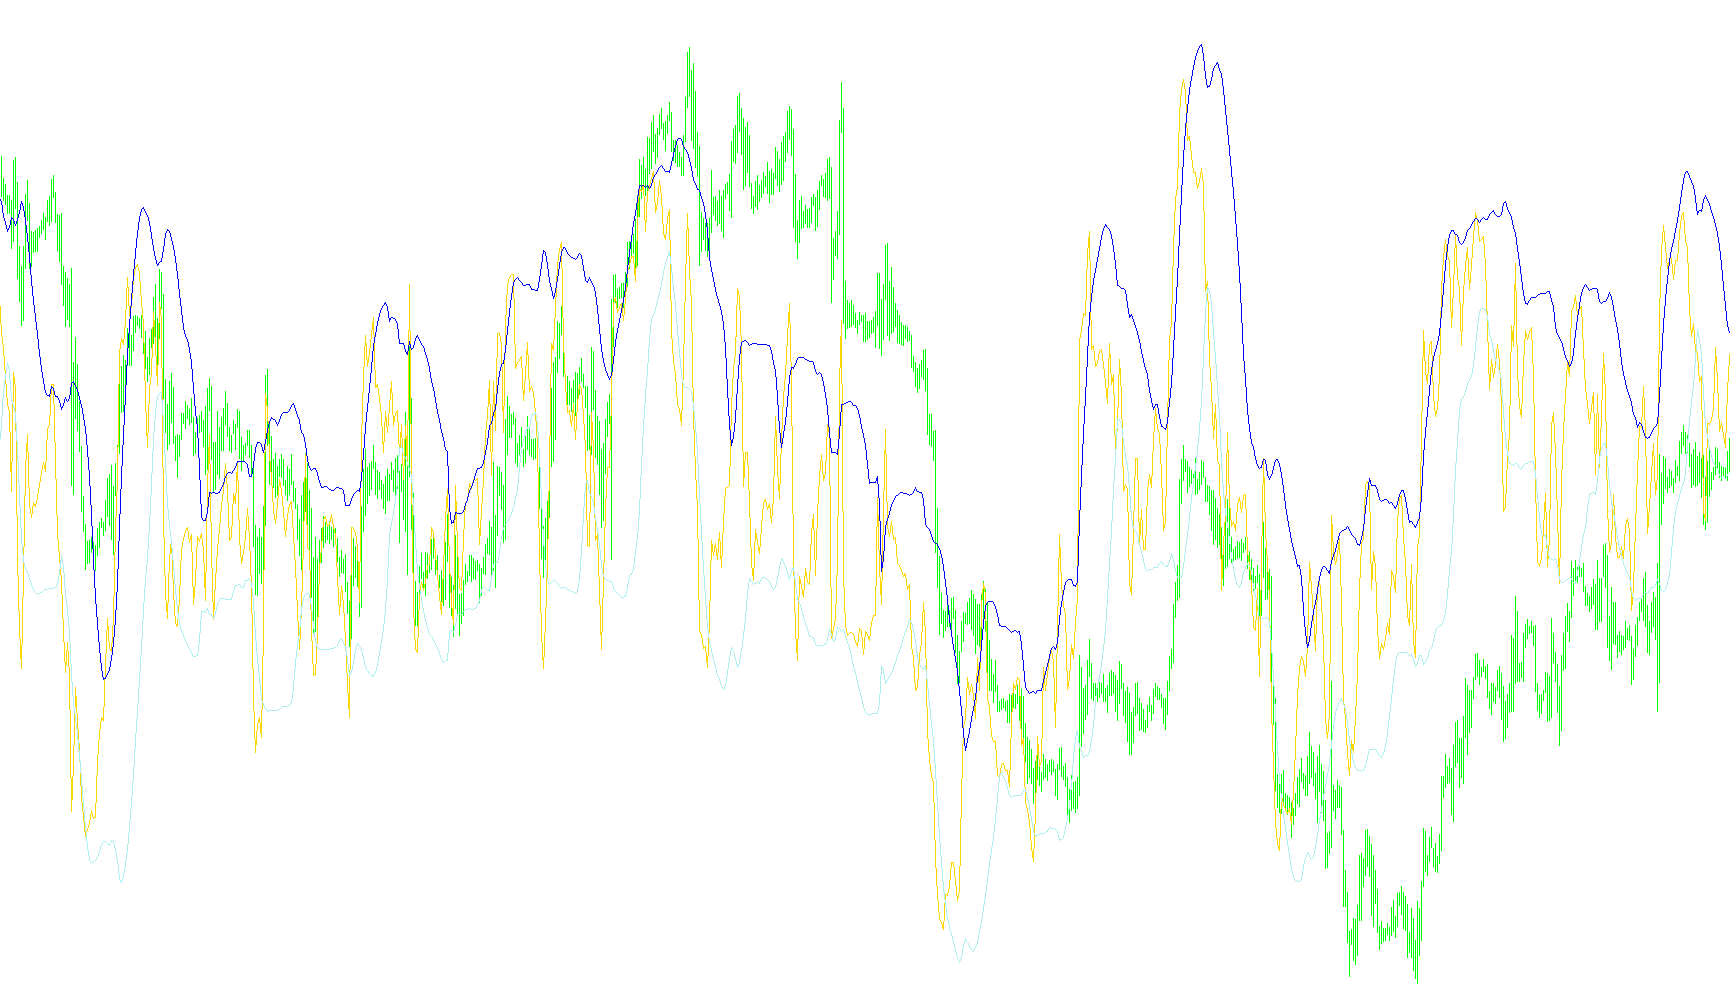
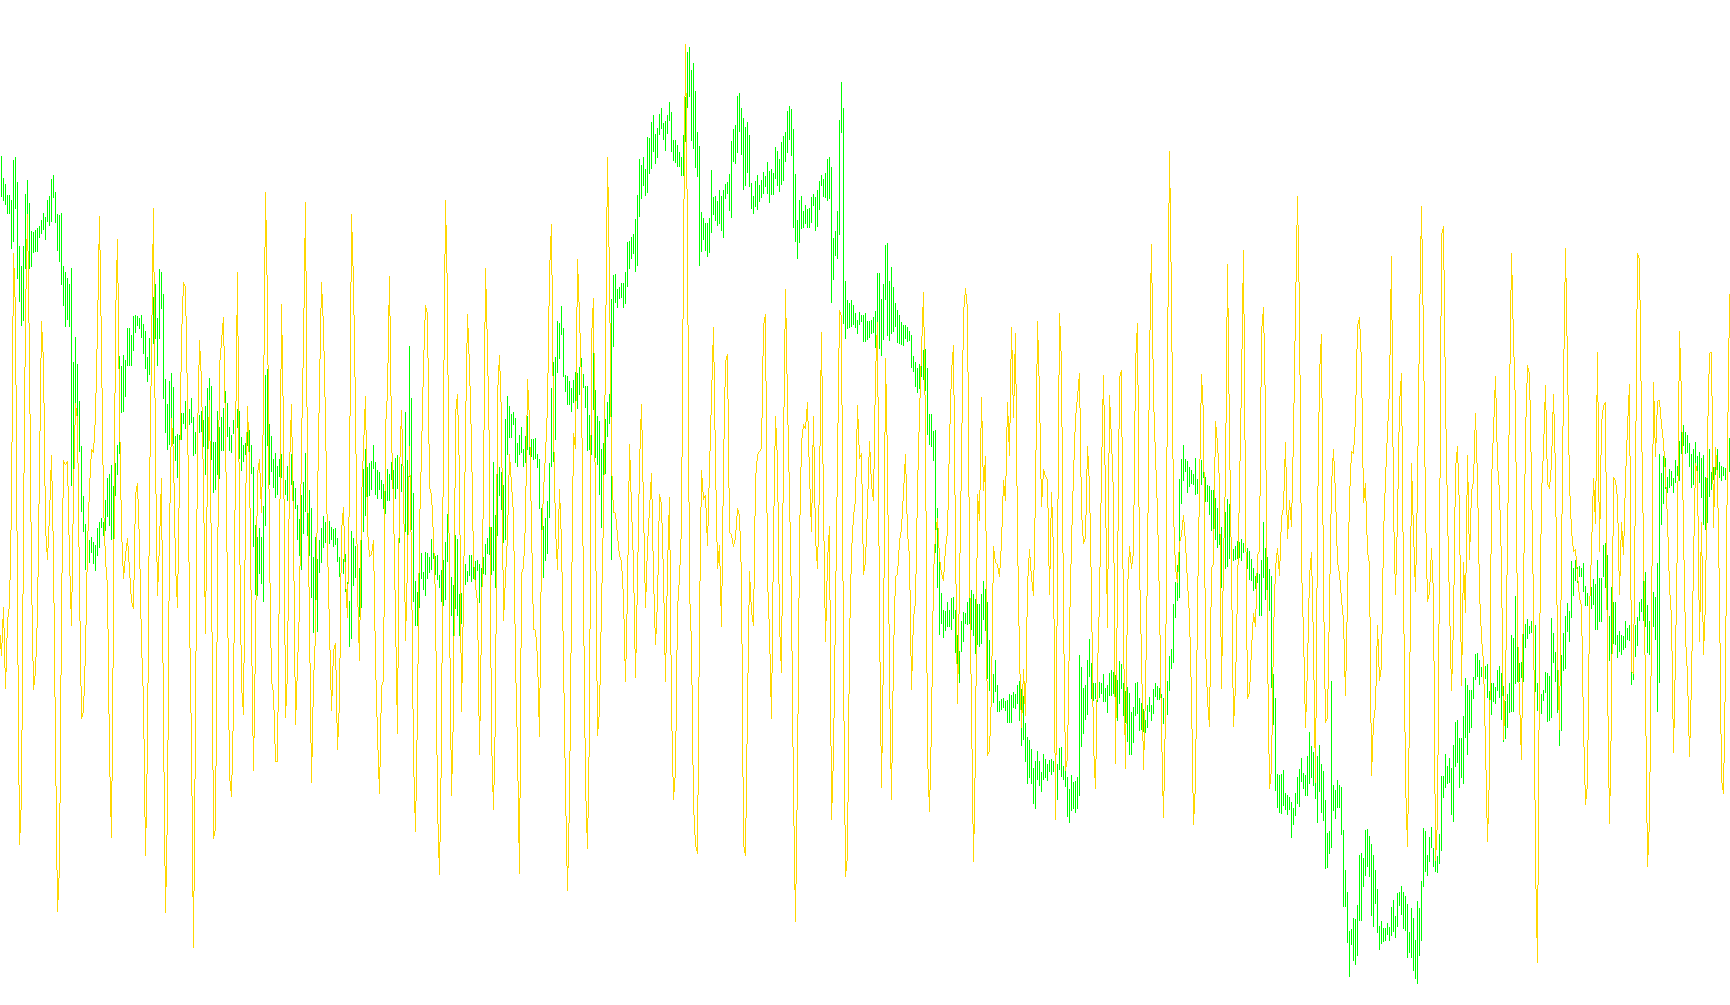
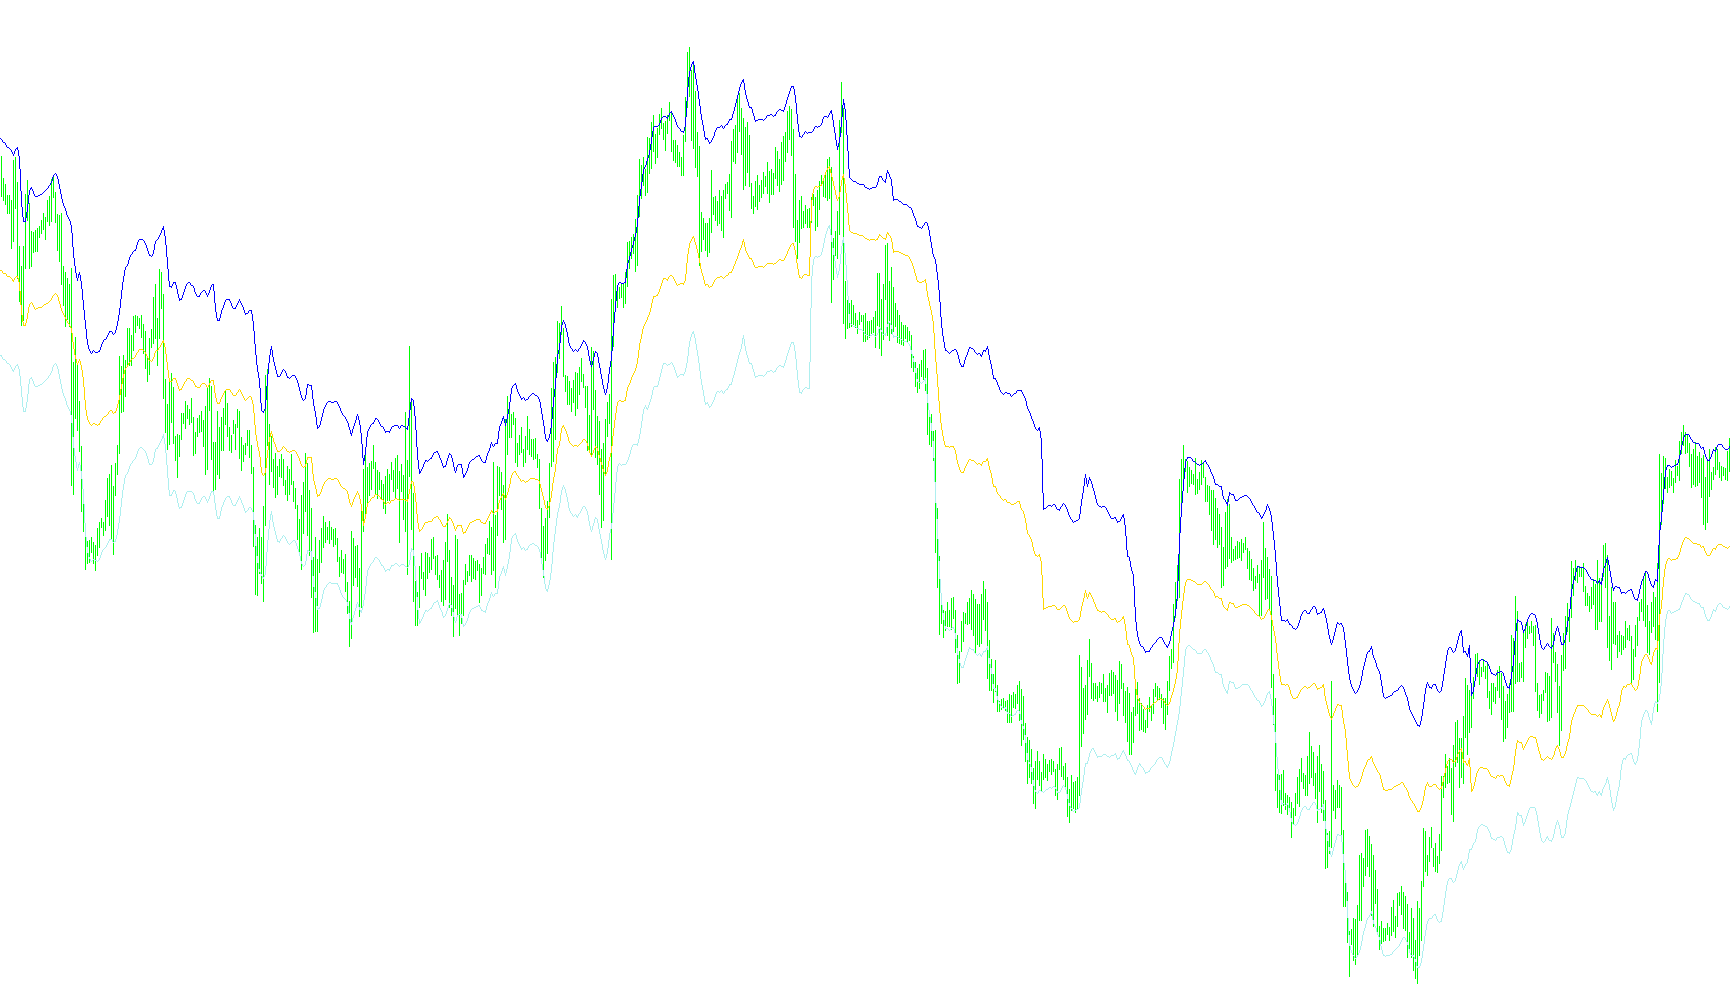
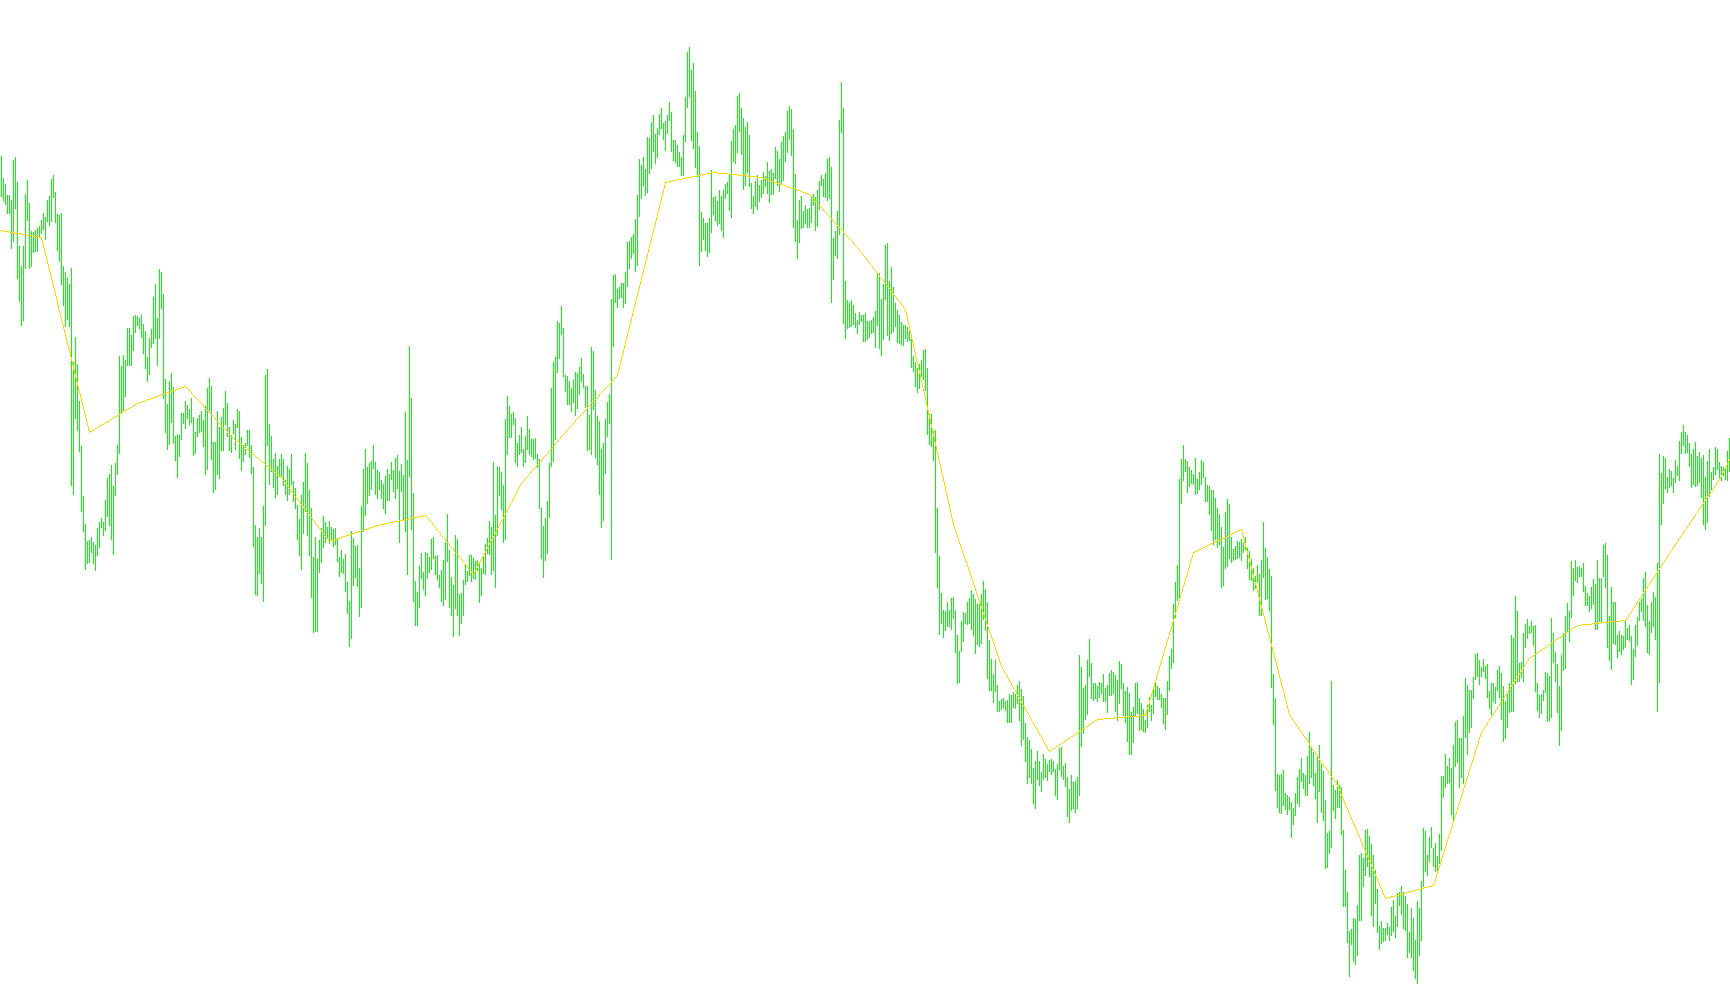
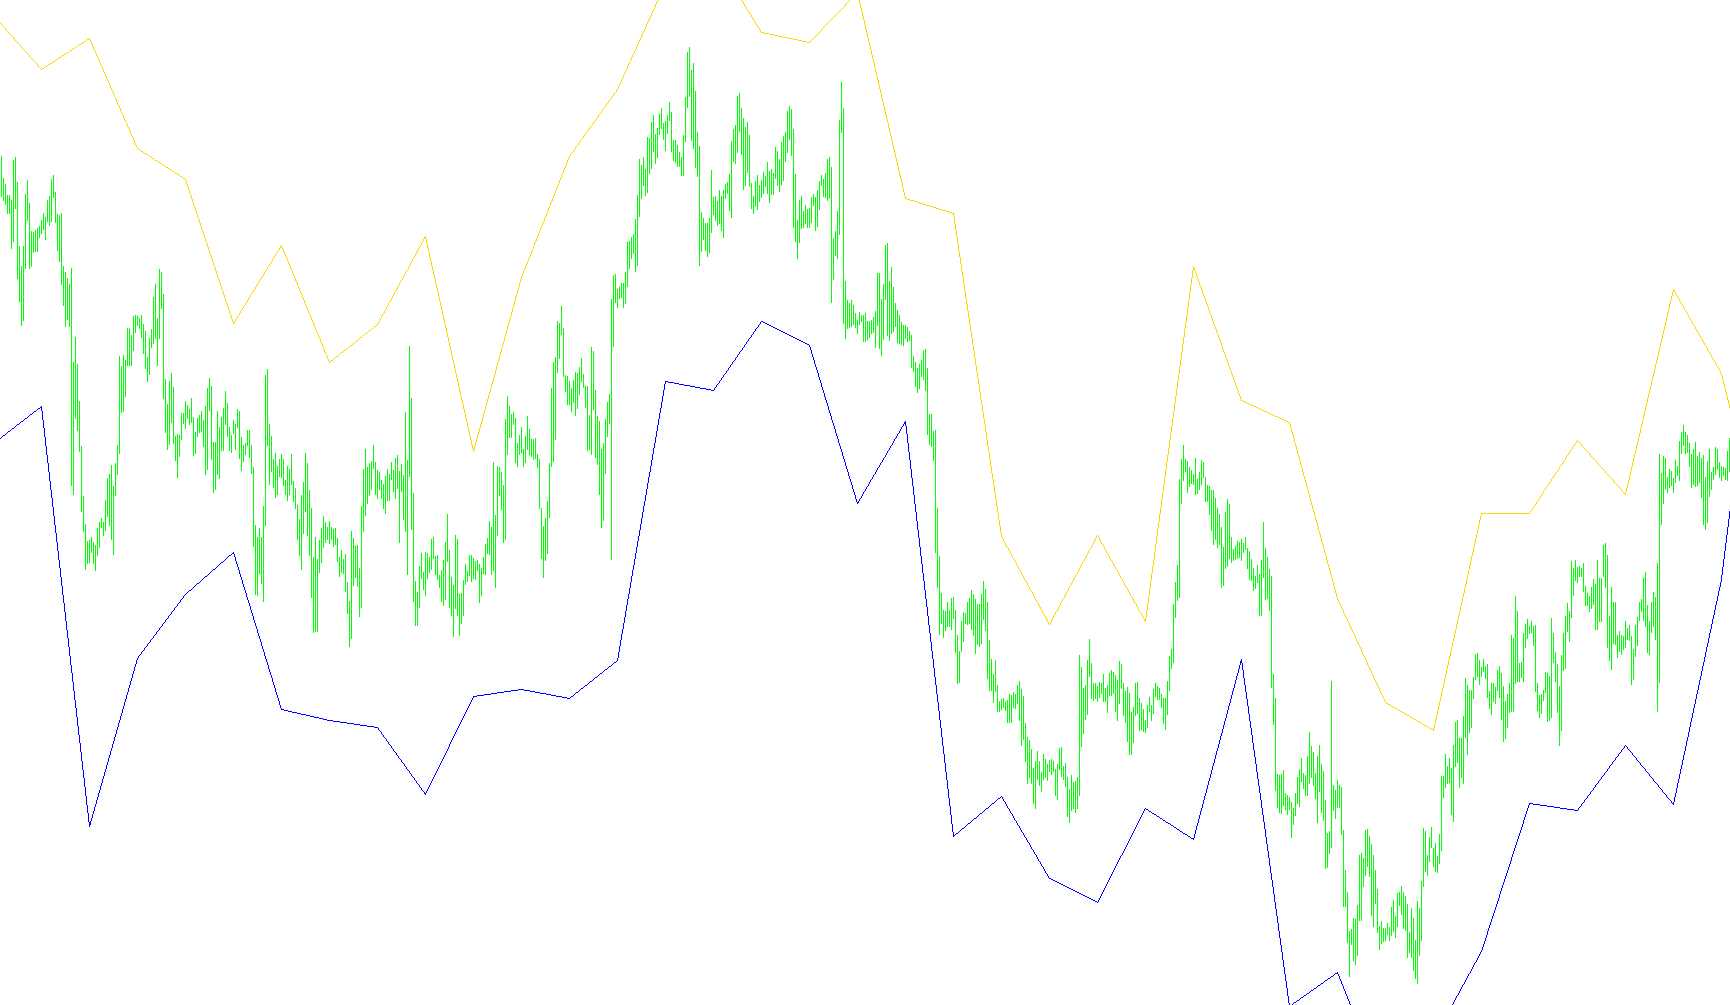
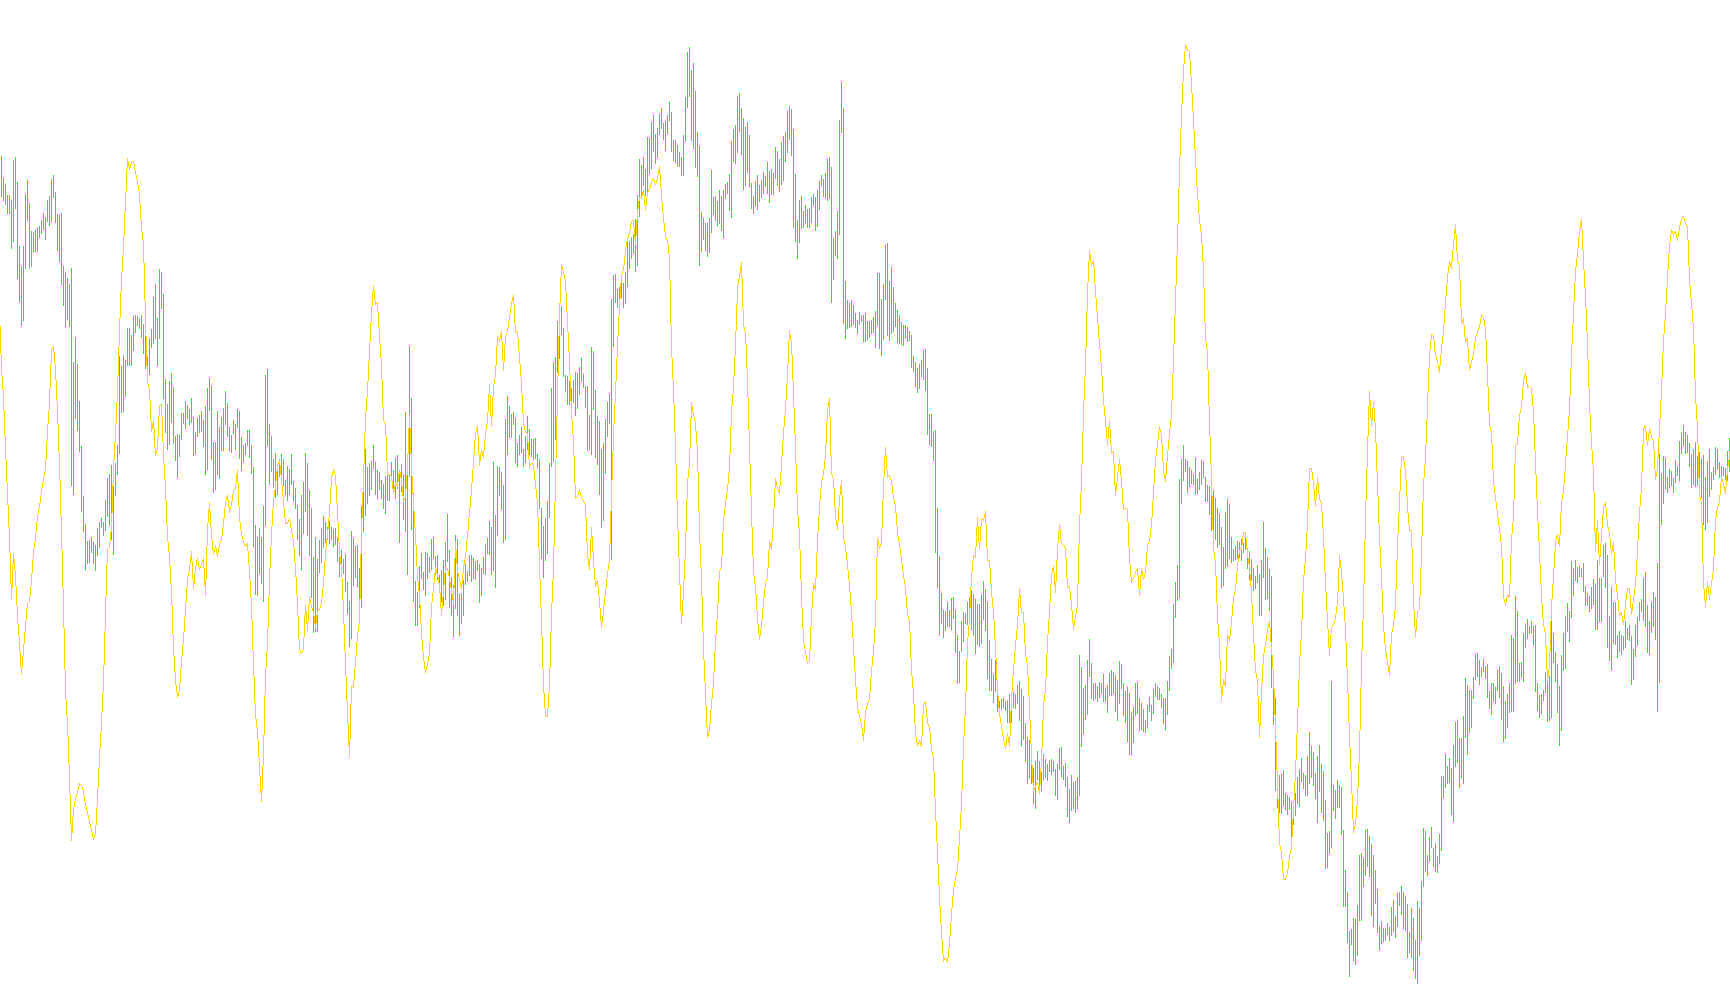
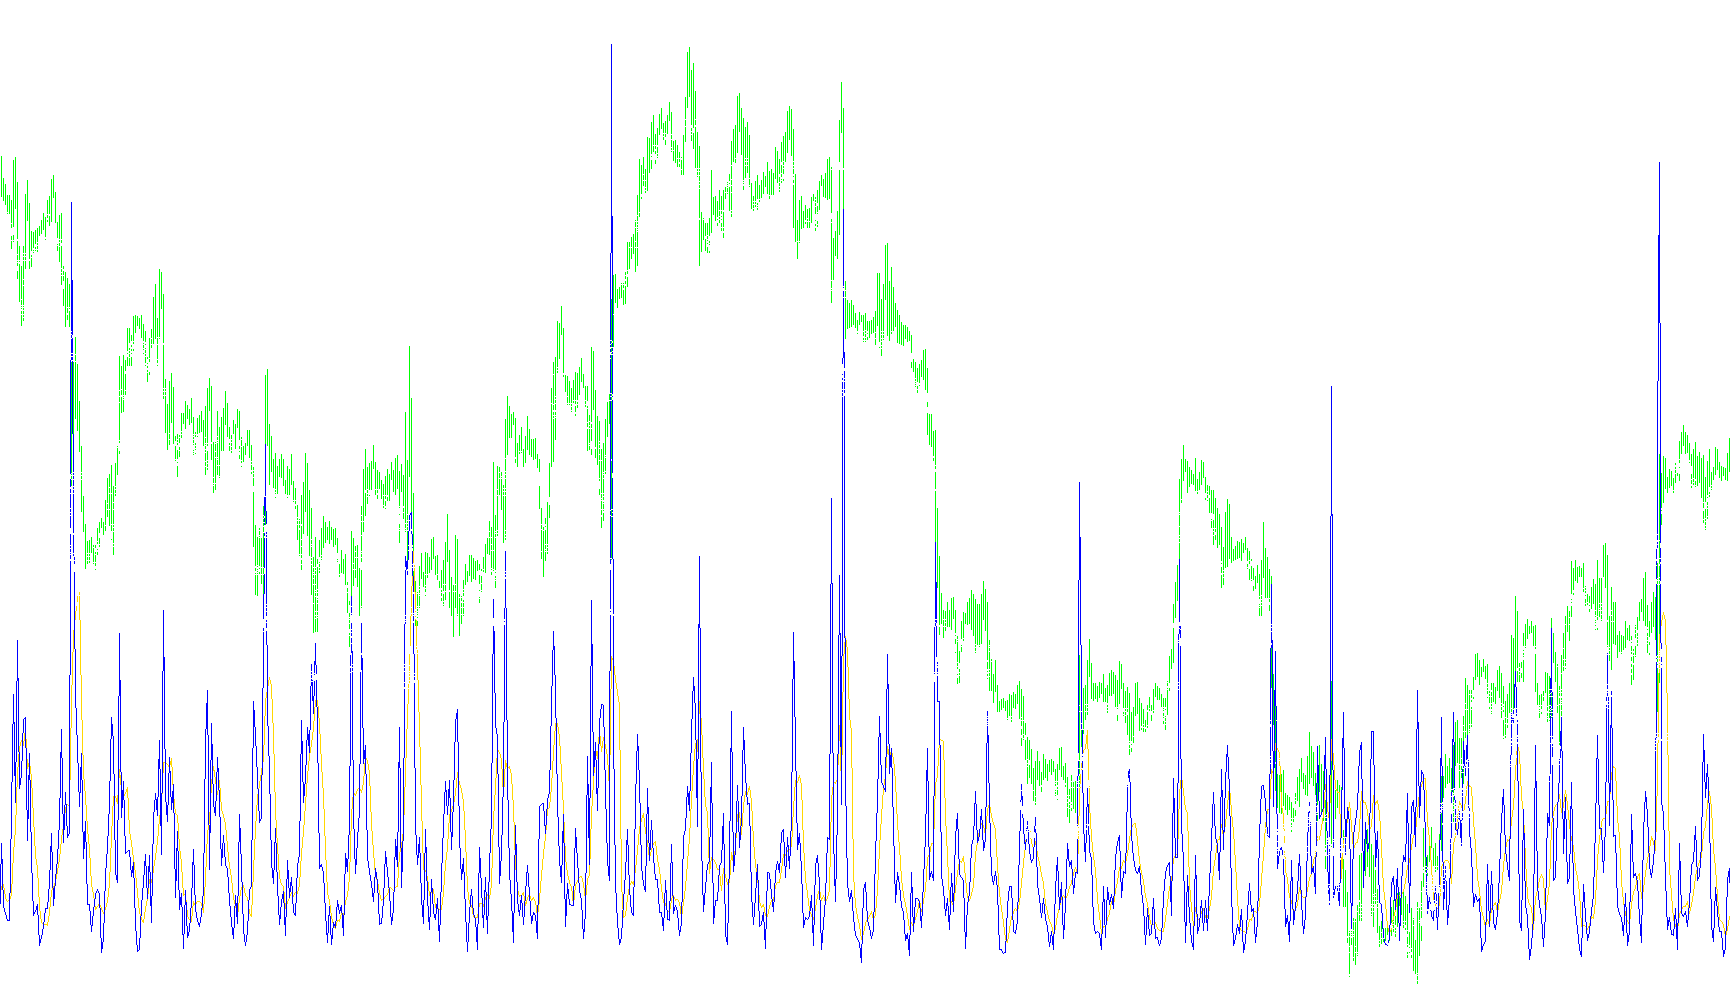
This indicator overlays Bollinger Bands and an Exponential Moving Average directly onto the Stochastic Oscillator's K-line to identify dynamic momentum zones and volatility extremes.

DYNAMIC_Breakout_Daily_Range_v11
Indicator

DYNAMIC_Breakout_Daily_Range_v11

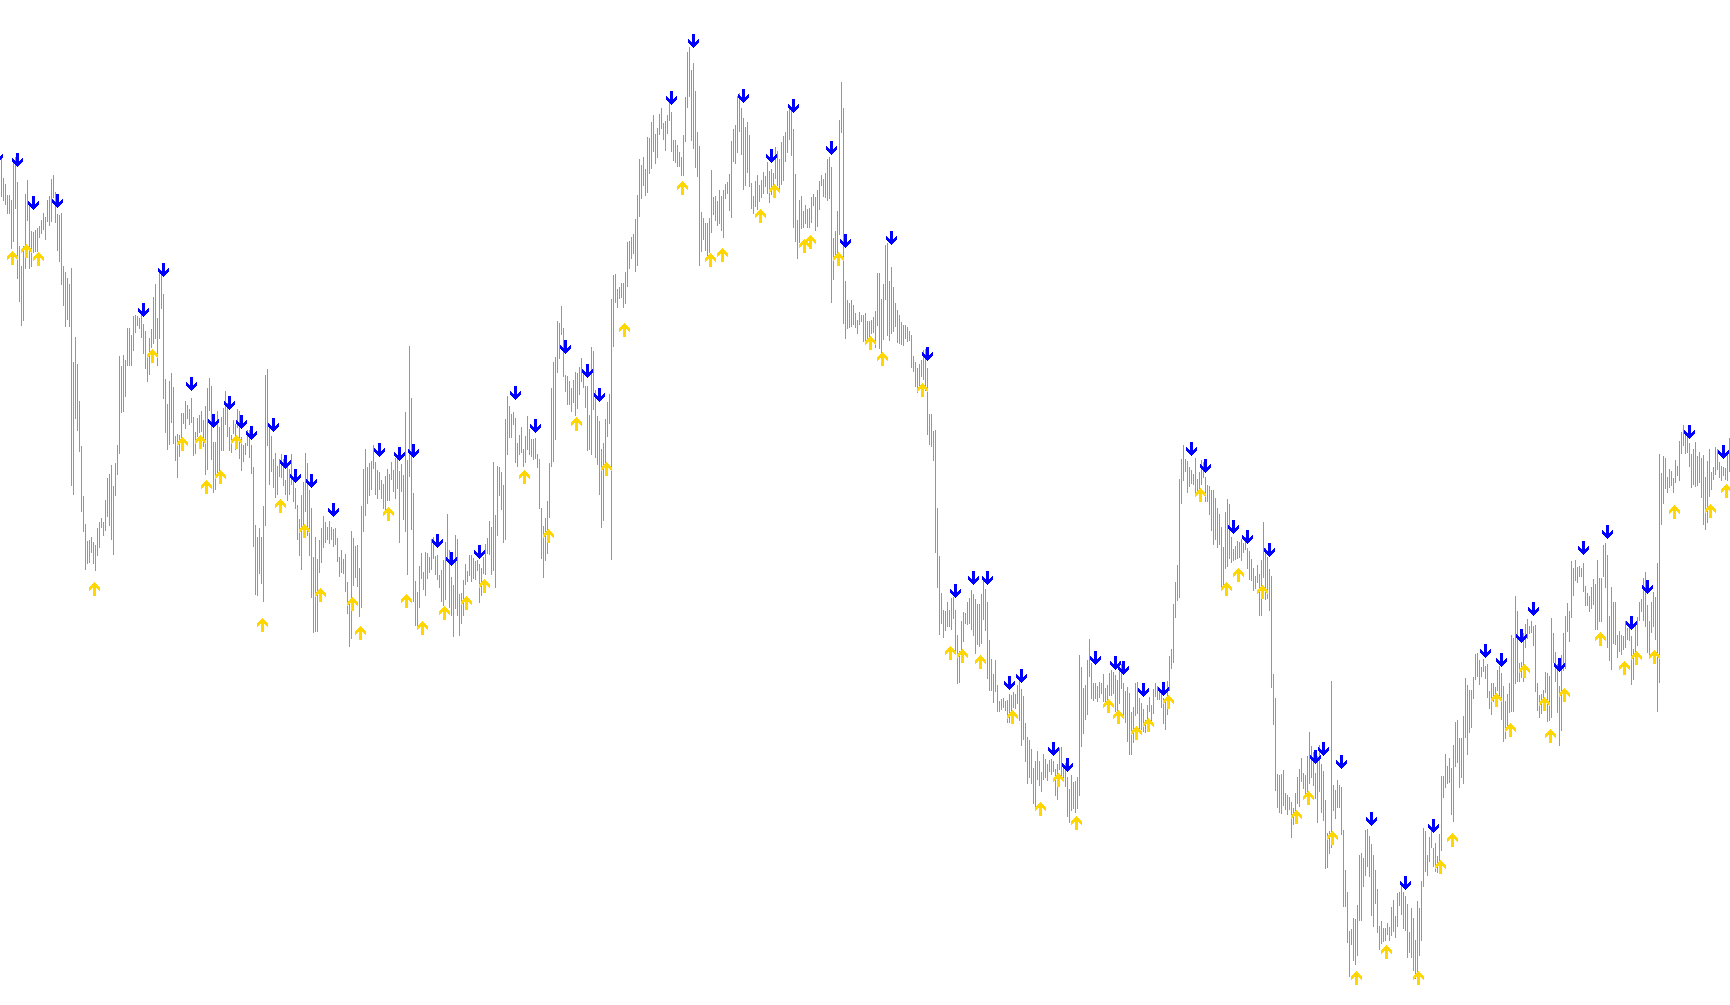
Calculates multi-temporal volatility averages to determine objective price corridors and risk-adjusted stop loss levels based on historical daily range persistence.

Dynamic_Pivot_v3
Indicator

Dynamic_Pivot_v3

This indicator calculates and maps daily pivot points based on previous session highs, lows, and closing prices while analyzing directional price slopes.

Dynamic_trend_cleaned_up
Indicator

Dynamic_trend_cleaned_up

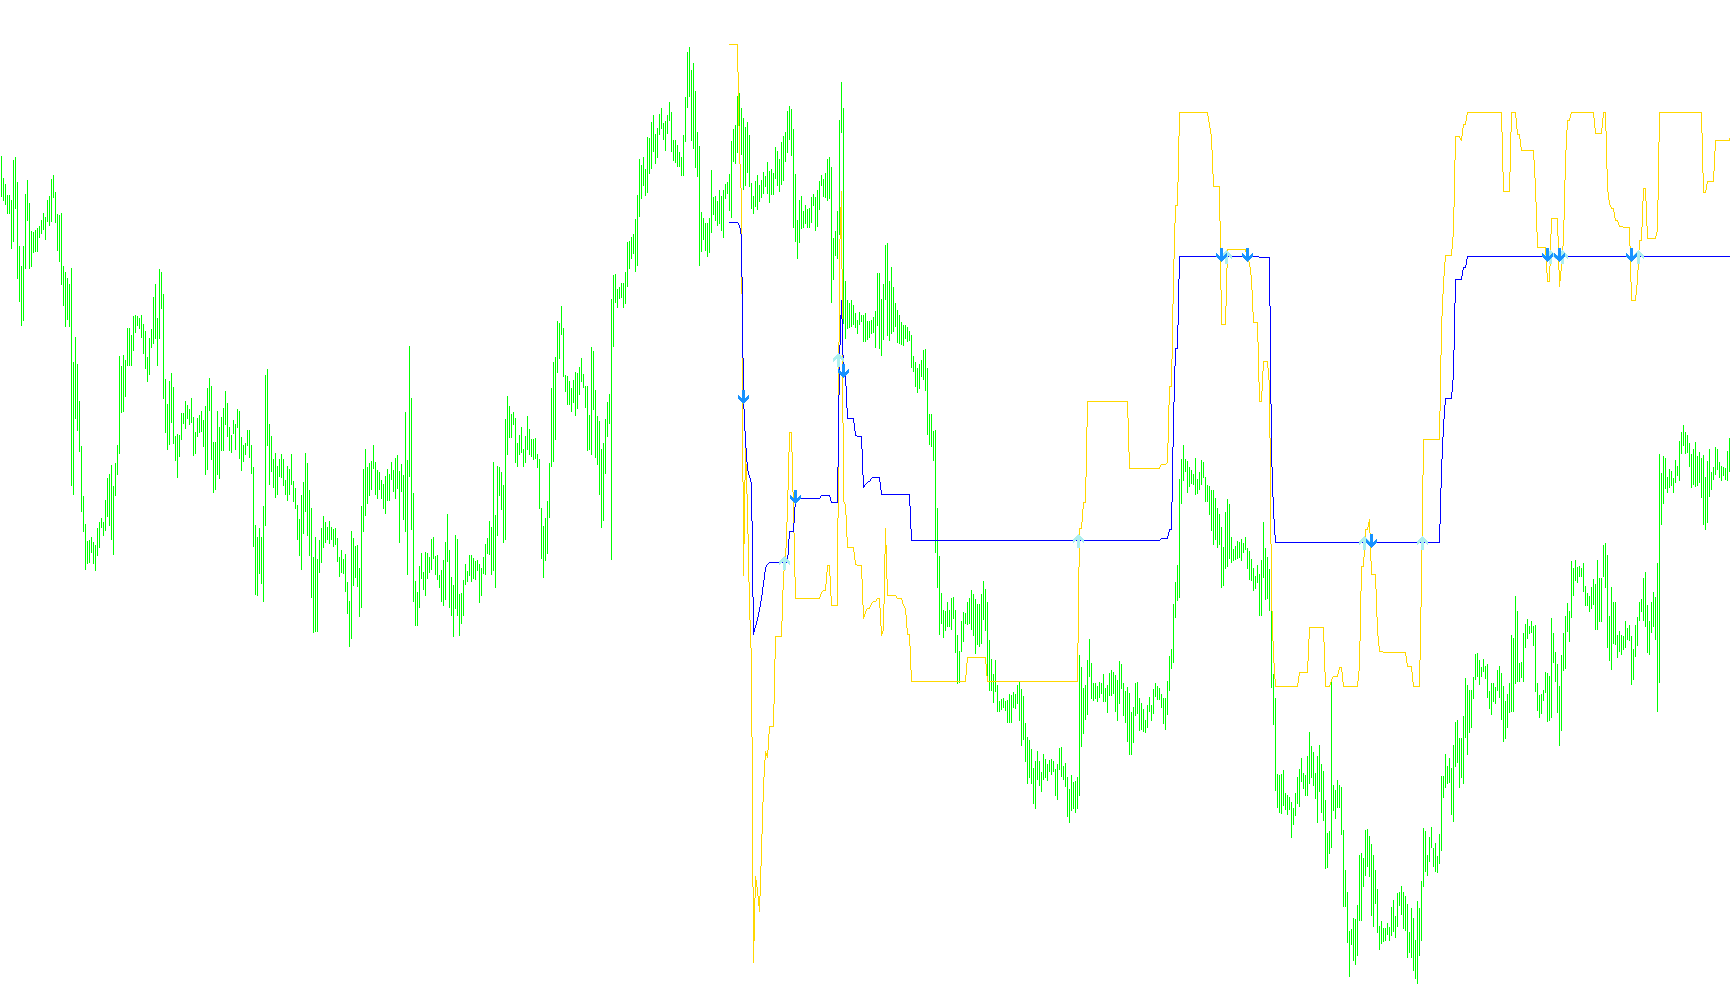
This indicator identifies trend reversals by detecting price violations of a fluctuating channel constructed from highest high and lowest low extremes adjusted by a specific percentage offset.

Dynamic_Zone_RSI2
Indicator

Dynamic_Zone_RSI2

iRSI

This indicator generates dynamic upper and lower boundaries by calculating a moving average of the RSI combined with standard deviation multipliers to identify extreme momentum zones.

Dynamo Stochastic
Indicator

Dynamo Stochastic

iMAOnArray

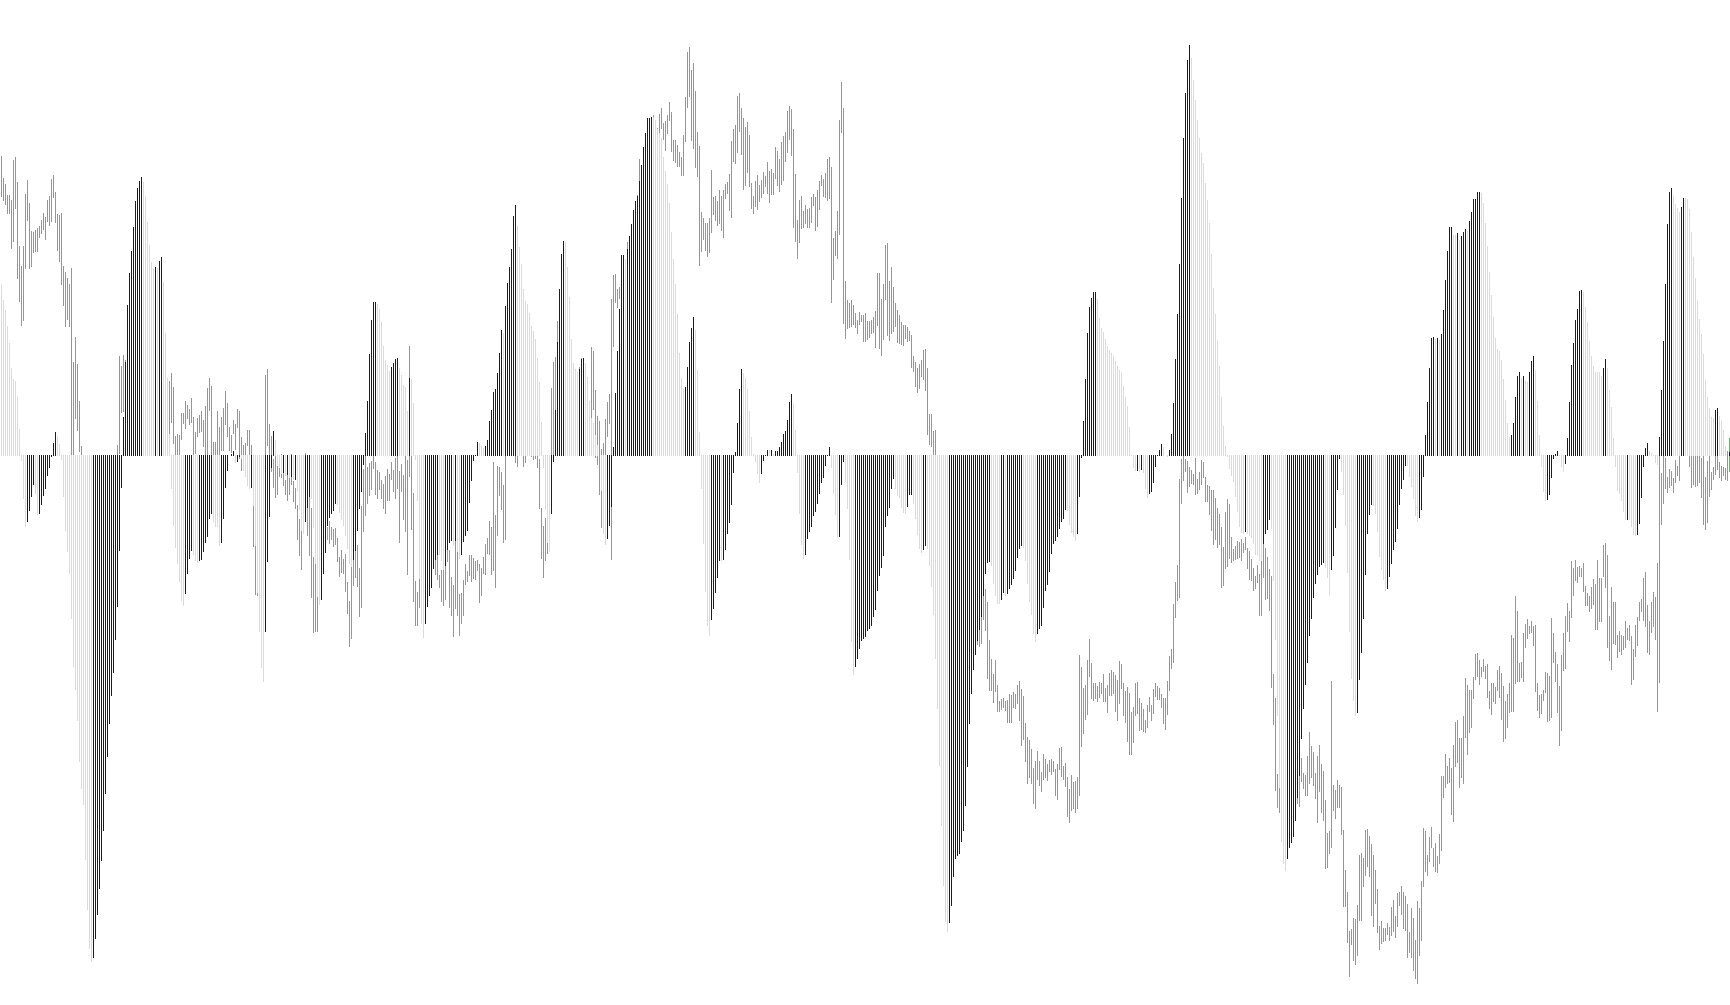
This indicator synthesizes a standard stochastic oscillator with a unique 'Dynamo' calculation that measures the relative variance between the main %K line and its moving average signal against a central equilibrium.

Dynamo Stochastic_v1
Indicator

Dynamo Stochastic_v1

iMAOnArray

This indicator calculates a modified stochastic momentum by blending the %K line and its simple moving average signal against a 50-point equilibrium axis.

DynFloatPivot
Indicator

DynFloatPivot

Calculates a weighted central mean using period extremes and adjacent closing prices to derive multi-level structural support and resistance zones.

DynFloatPivotM
Indicator

DynFloatPivotM

This indicator projects multiple price equilibrium levels by calculating arithmetic averages of historical highs, lows, and recent closing prices.

Dyn_Pivot
Indicator

Dyn_Pivot

This indicator calculates and projects historical pivot points by synthesizing the previous day's high, low, and closing prices using customizable weighted averages.

Dyn_Range2
Indicator

Dyn_Range2

This indicator calculates daily pivot points and symmetrical range boundaries based on the previous day's high, low, and closing price across multiple formulaic variations.

Dyn_tr
Indicator

Dyn_tr

Identifies trend reversals by detecting price crossovers against a volatile boundary adjusted by a fixed percentage of the asset's point value.

dzani9_Elliotwave_confirmation
Indicator

dzani9_Elliotwave_confirmation

iMA

This indicator identifies trend reversal points by detecting specific crossover alignments between two Linear Weighted Moving Averages while filtering signals based on local price volatility ranges.

dzani9_MajorTrendSignal
Indicator

dzani9_MajorTrendSignal

This indicator calculates rolling volatility ranges to establish dynamic support and resistance boundaries, generating buy and sell signals based on price momentum crossing relative trend thresholds.

Dzani9_Minor_in_Major_Elliott_Wave
Indicator

Dzani9_Minor_in_Major_Elliott_Wave

iMA

The logic identifies structural momentum shifts by tracking the directional slope of a dual SMA differential to isolate trend-reversal points.

D_RSI
Indicator

D_RSI

This indicator calculates a standard Relative Strength Index and applies successive layers of multi-period linear regression weighting to smooth signal noise and identify high-probability momentum trends.

D_RSI_v1
Indicator

D_RSI_v1

This indicator calculates a Relative Strength Index that applies successive weighted polynomial filters to dampen noise and enhance trend persistence.

e-MoveSLTPbyMouse
Indicator

e-MoveSLTPbyMouse

An automated management tool that synchronizes active trade positions with real-time mouse-draggable graphical objects to dynamically adjust stop-loss and take-profit levels.

e-MovingInWL
Indicator

e-MovingInWL

This automated script monitors open positions and dynamically adjusts stop-loss levels to the entry price once a predefined profit threshold is reached, ensuring capital preservation.

e-Smart_Tralling
Indicator

e-Smart_Tralling

This automated system dynamically adjusts stop-loss thresholds across three progressive profit milestones while providing partial position liquidation and adaptive trailing mechanisms.

e-TLE_v.1.6
Indicator

e-TLE_v.1.6

This EA manages open positions by dynamically moving stop-loss levels through three distinct profit tiers before transitioning into a continuous trailing stop mode.

e-TLE_v.1.7
Indicator

e-TLE_v.1.7

An automated trade management system that dynamically adjusts stop-loss levels through three progressive profit zones, featuring partial position closing and recursive trailing logic.

e-Trailing
Indicator

e-Trailing

This script automatically adjusts stop-loss levels for active trades based on real-time price fluctuations to secure unrealized gains while maintaining a predefined buffer.

e-Trailing_v1
Indicator

e-Trailing_v1

Dynamically updates stop-loss levels across specific or global trades to secure gains based on predefined point increments and profit thresholds.

e-Trailing_v2
Indicator

e-Trailing_v2

Dynamically adjusts stop-loss levels to lock in realized gains based on fixed point intervals and incremental step adjustments across multiple active positions.

e-TSAtr_NRTR_Last
Indicator

e-TSAtr_NRTR_Last

This script implements a dual-mode trailing stop logic that adjusts position protection based on either historical Average True Range (ATR) volatility or local price range extremes.

Easy_iCustom_and_Alerts
Indicator

Easy_iCustom_and_Alerts

Easy_iCustom_and_Alerts_Cowboy
Indicator

Easy_iCustom_and_Alerts_Cowboy

Easy_iCustom_and_Alerts_v1
Indicator

Easy_iCustom_and_Alerts_v1

A dynamic configuration tool that retrieves real-time values from multiple external indicators to trigger instant notifications upon price or buffer intersections.

Easy_iCustom_and_Alerts_v2
Indicator

Easy_iCustom_and_Alerts_v2

This tool retrieves data from multiple external custom indicators via iCustom and triggers real-time notifications upon identifying specific directional crossovers between their respective buffers.

Indicator

ea_candlestick

Indicator

ea_matt_candlestick_v10_MT4

ECO
Indicator

ECO

iMAOnArray

This indicator calculates a normalized ratio between smoothed price action (Open-Close) and volatility (High-Low) to identify trend momentum and exhaustion points.

ECO_v1
Indicator

ECO_v1

iMAOnArray

This indicator quantifies relative price momentum by calculating the ratio of nested moving averages of candle bodies against their total ranges to identify overextended market behavior.

EES V Speed v1.1
Indicator

EES V Speed v1.1

iMAOnArray

This indicator calculates a smoothed moving average of the price range per point to quantify and visualize market expansion speed.

EES-USDX
Indicator

EES-USDX

This indicator calculates a weighted aggregate of major currency pairs to simulate the USDX movement using power-based exponential weighting.

Ehlers COG
Indicator

Ehlers COG

This indicator calculates a weighted average of mid-price points where the proximity to current price determines the magnitude of influence, effectively identifying the gravitational center of a specific lookback period.

Ehlers Fisher transform histo
Indicator

Ehlers Fisher transform histo

iMA

This indicator normalizes price oscillations into a bounded range using a sigmoid-like transform to highlight momentum shifts and trend exhaustion.

Ehlers Fisher transform
Indicator

Ehlers Fisher transform

iMA

This indicator applies a logarithmic transformation to price extremes to normalize oscillations, enhancing the identification of momentum reversals and overextended price action.

Ehlers iTrend
Indicator

Ehlers iTrend

This indicator constructs a sophisticated trend line by fusing an instantaneous linear regression slope with a cyclical component derived from sinusoidal phase shifts and high-pass filtering.

Ehlers Two Pole Super Smoother Filter
Indicator

Ehlers Two Pole Super Smoother Filter

This indicator implements a recursive signal processing algorithm to eliminate high-frequency noise and isolate underlying price trends using specialized trigonometric coefficients.

Ehlers ZeroLag EMA
Indicator

Ehlers ZeroLag EMA

This indicator utilizes a recursive optimization loop to minimize the deviation between price action and the moving average by dynamically calculating the best gain coefficient.
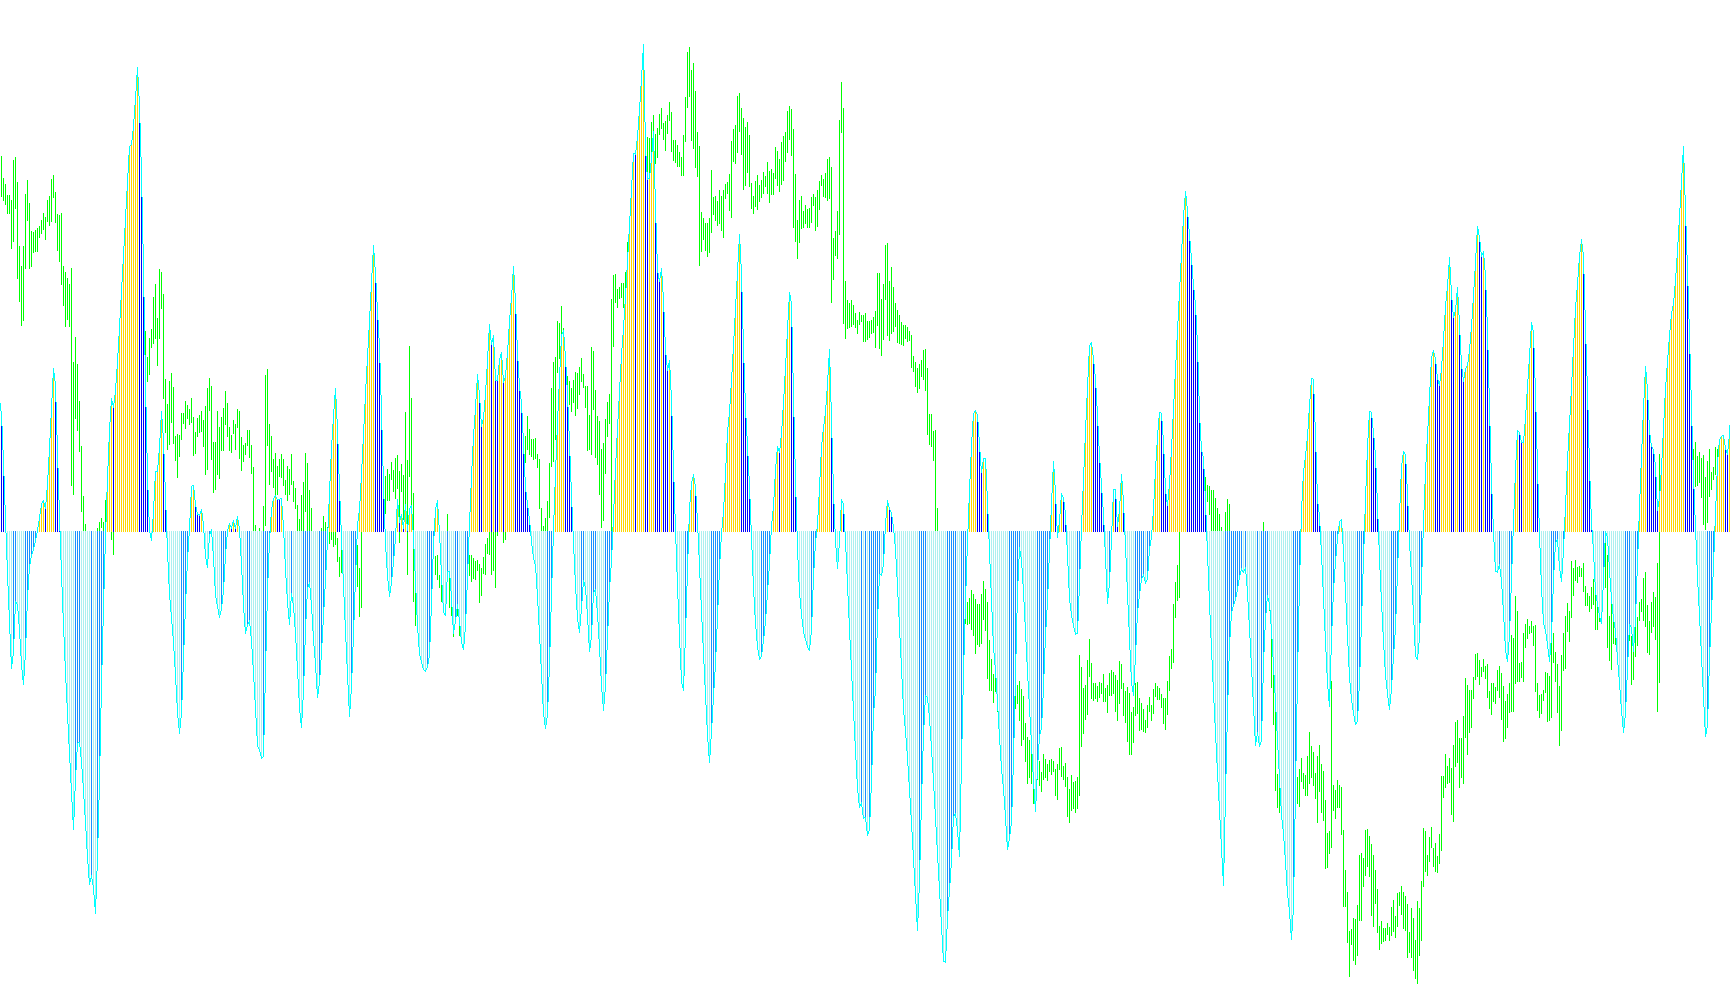
EhlersNonLinearFilter
Indicator

EhlersNonLinearFilter

This indicator calculates a weighted price average by applying an iterative variance-based coefficient to a multi-point smoothed price sequence.
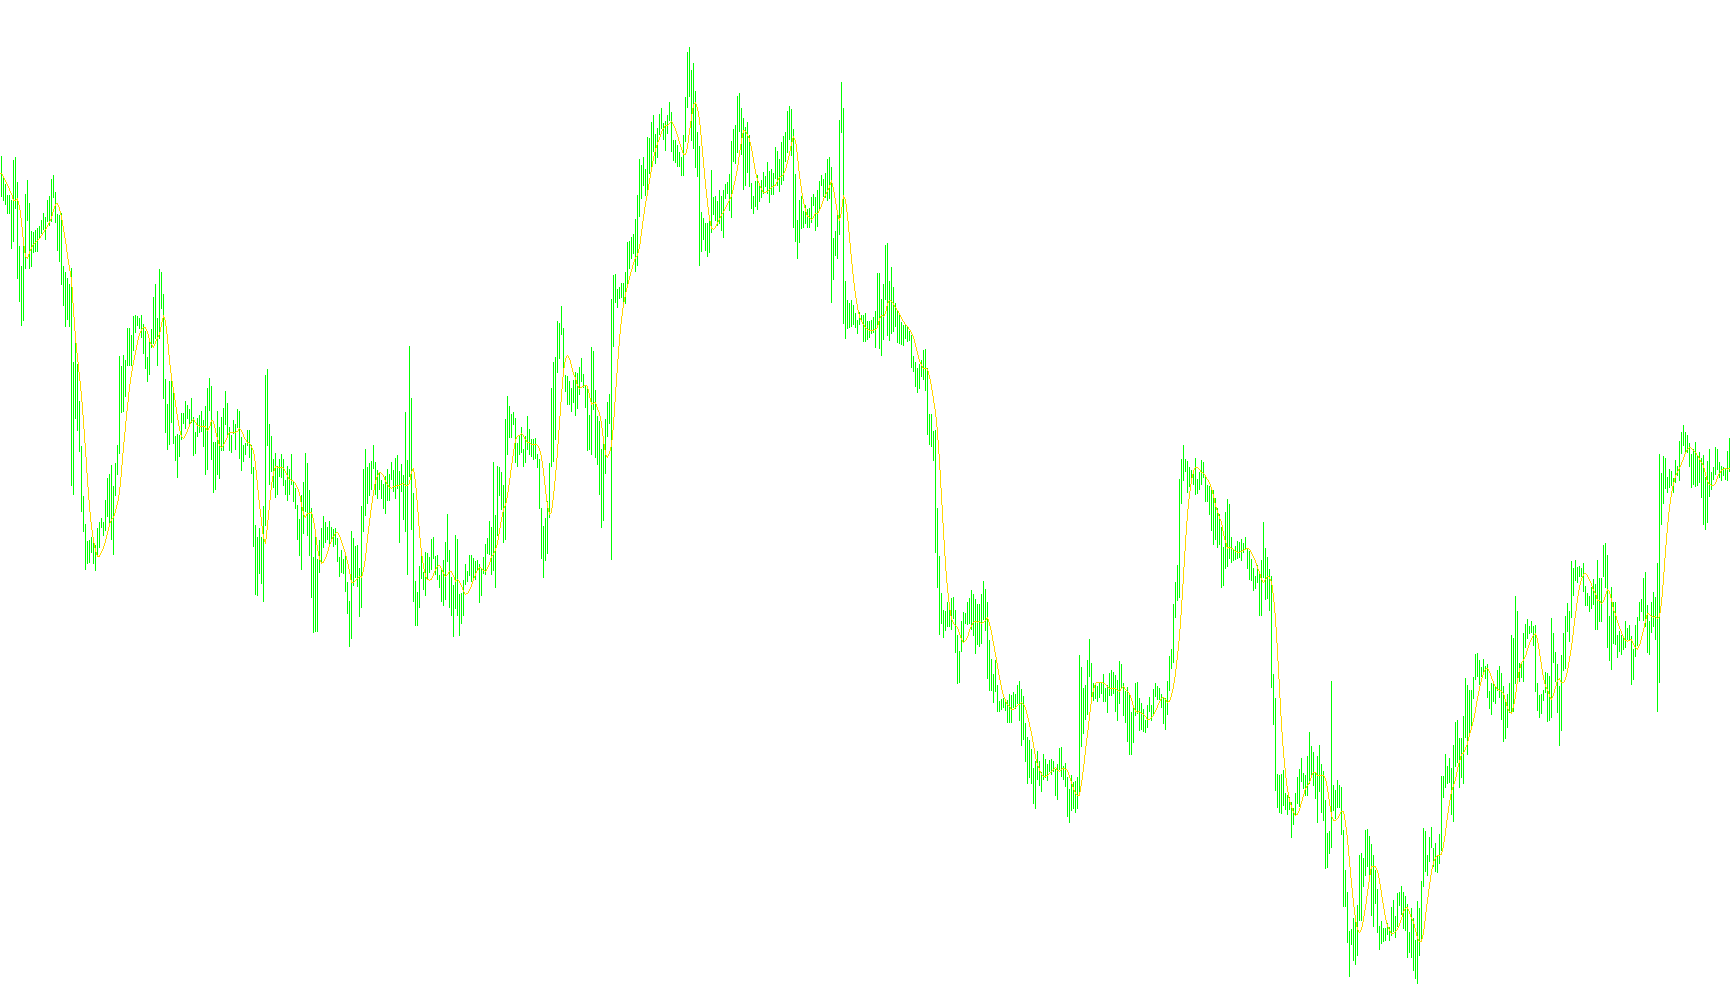
Ehlers_iTrend
Indicator

Ehlers_iTrend

This indicator synthesizes price action by blending a weighted SMA with an instantaneous slope component and a high-pass filtered cyclic signal to identify underlying directional momentum.

Indicator

Ehlers_iTrend_in_Color

Indicator

EJ_CandleTime

Indicator

EJ_CandleTimevbob

Indicator

EJ_CandleTime_Blue

Indicator

EJ_CandleTime_Blue_v1

Indicator

EJ_CandleTime_Blue_v2