DT-RSI-Sig_v4
Indicator

DT-RSI-Sig_v4

iRSI

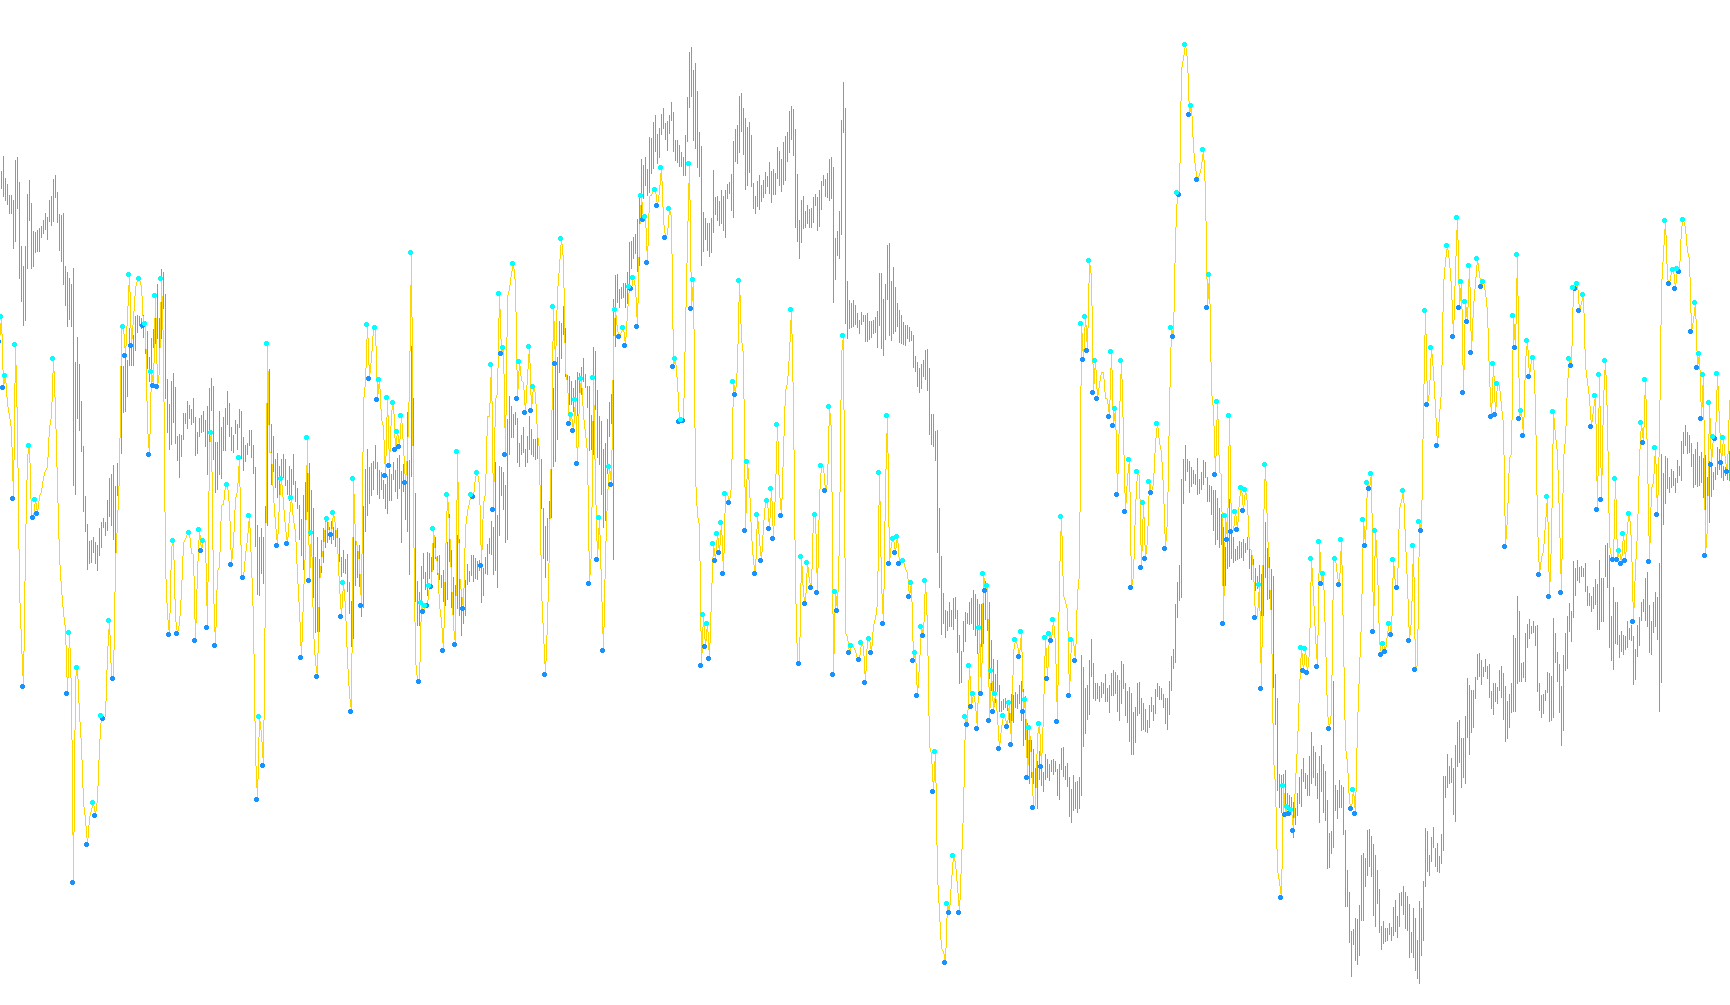
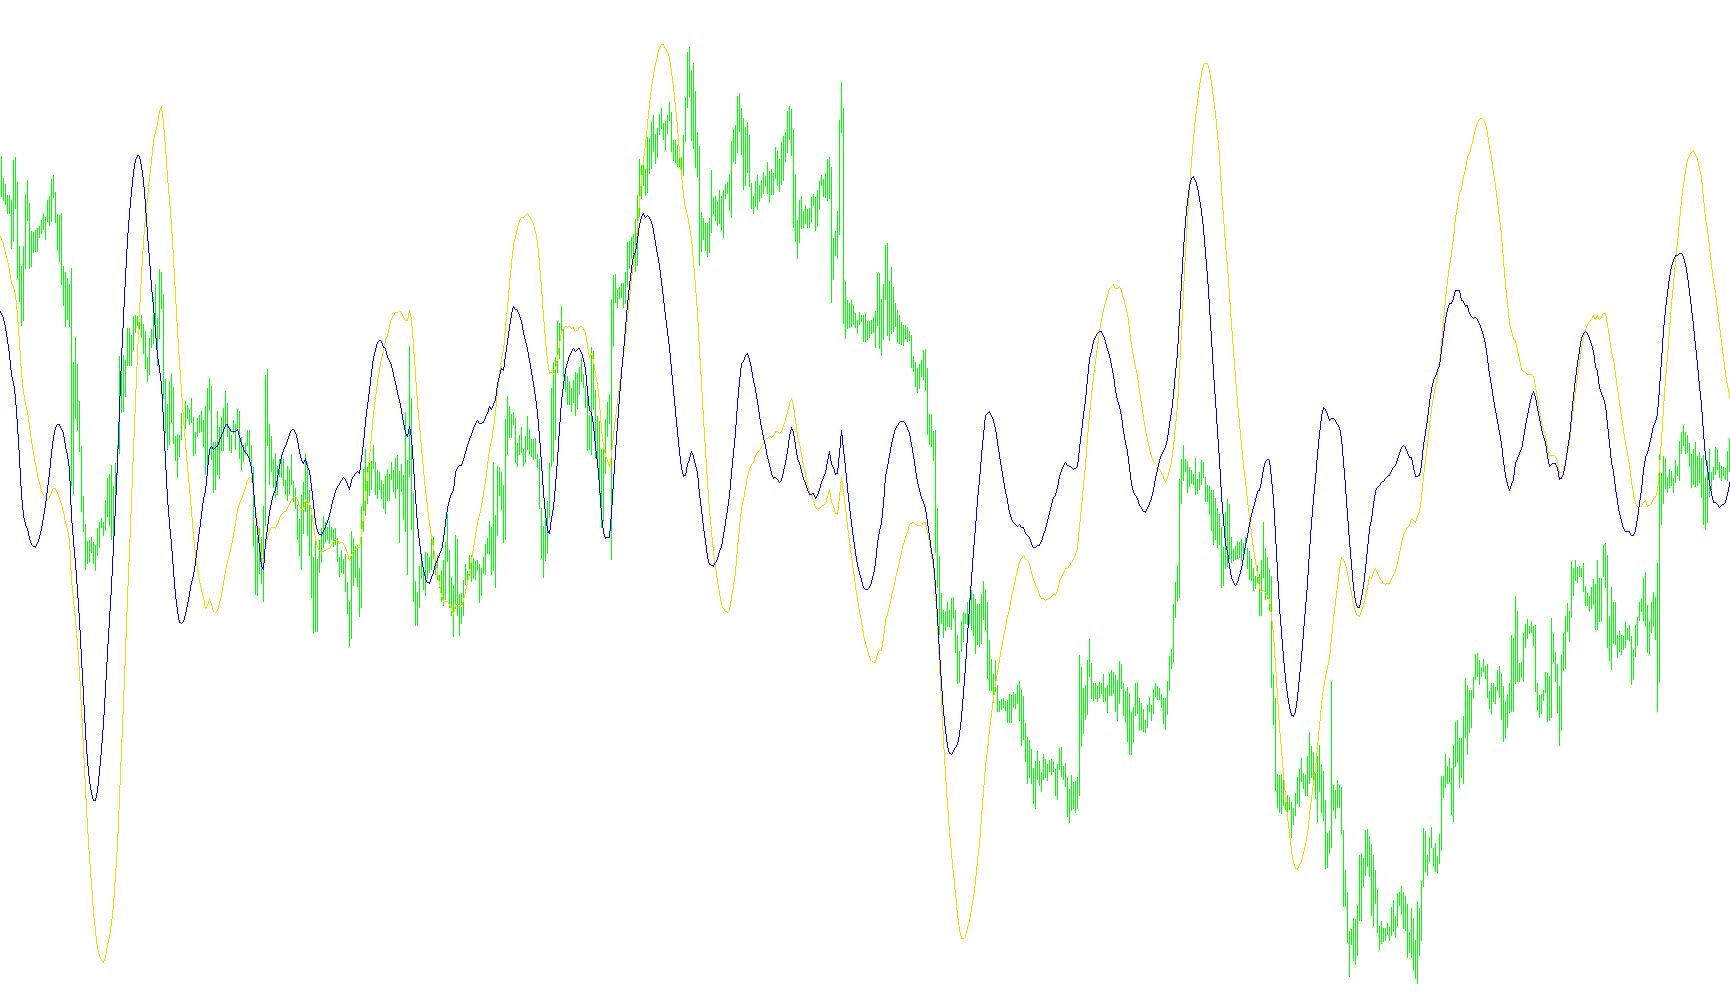
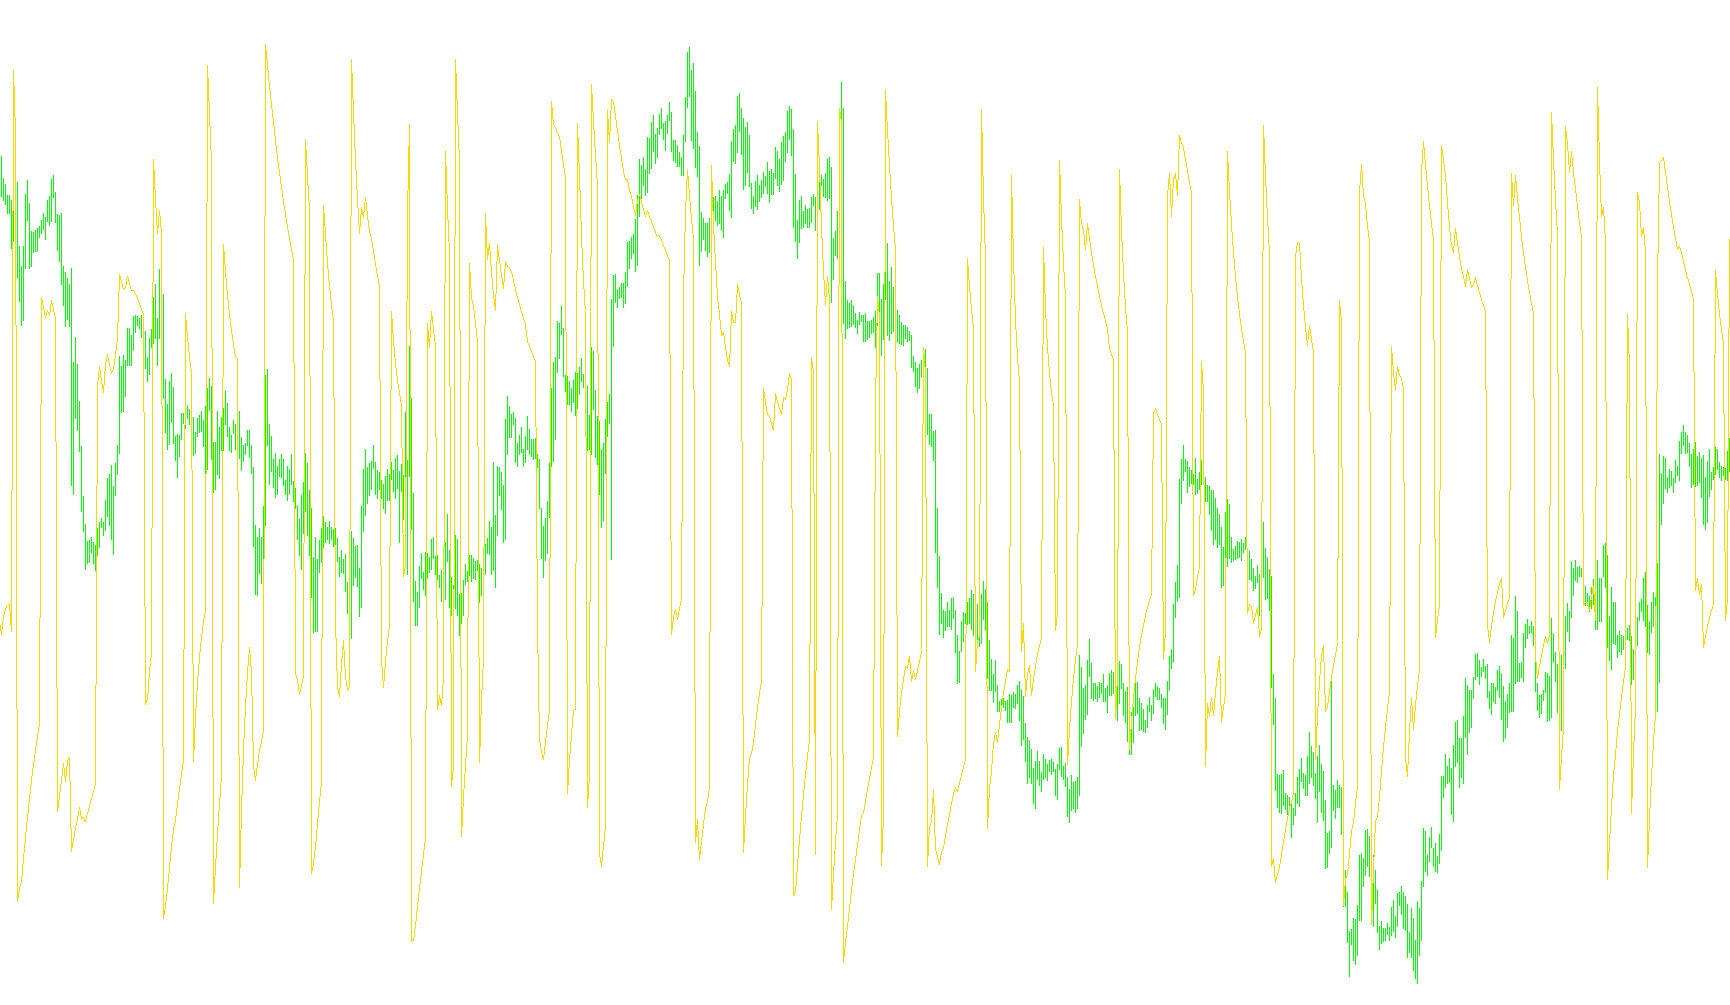
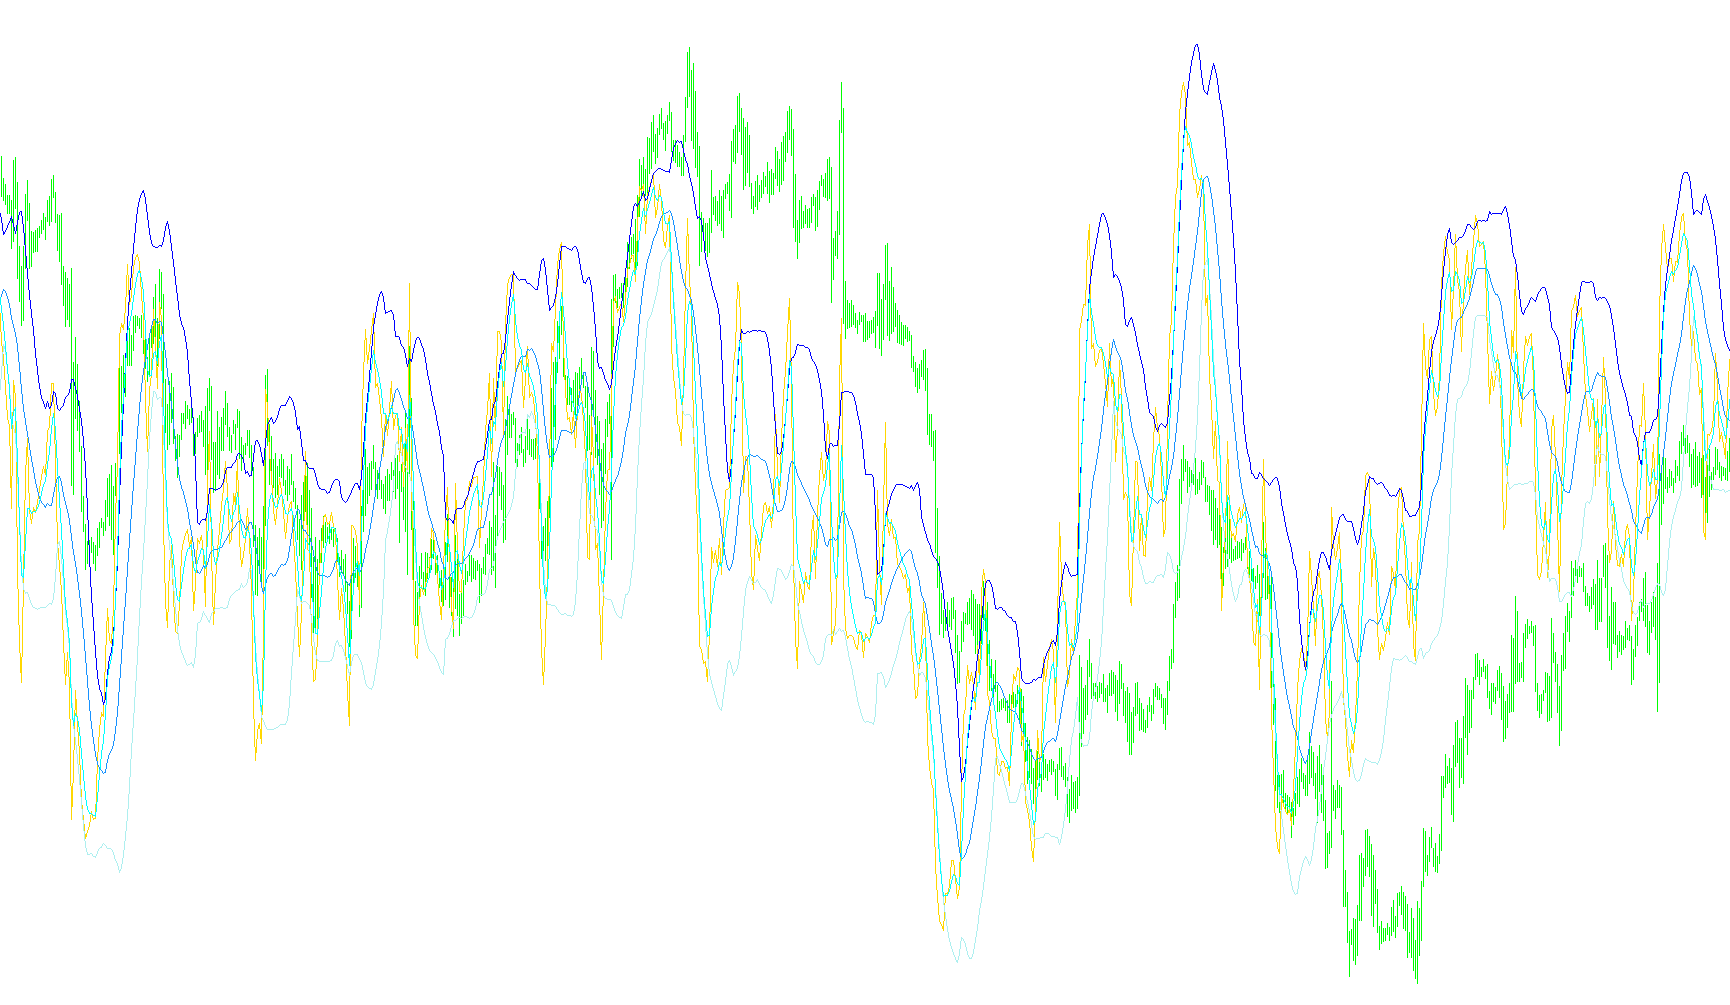
This indicator identifies trend reversals by detecting local extrema in the Relative Strength Index and plotting visual support/resistance lines based on linear interpolation between peak and trough price levels.

DT-ZigZag-ATR
Indicator

DT-ZigZag-ATR

iATR

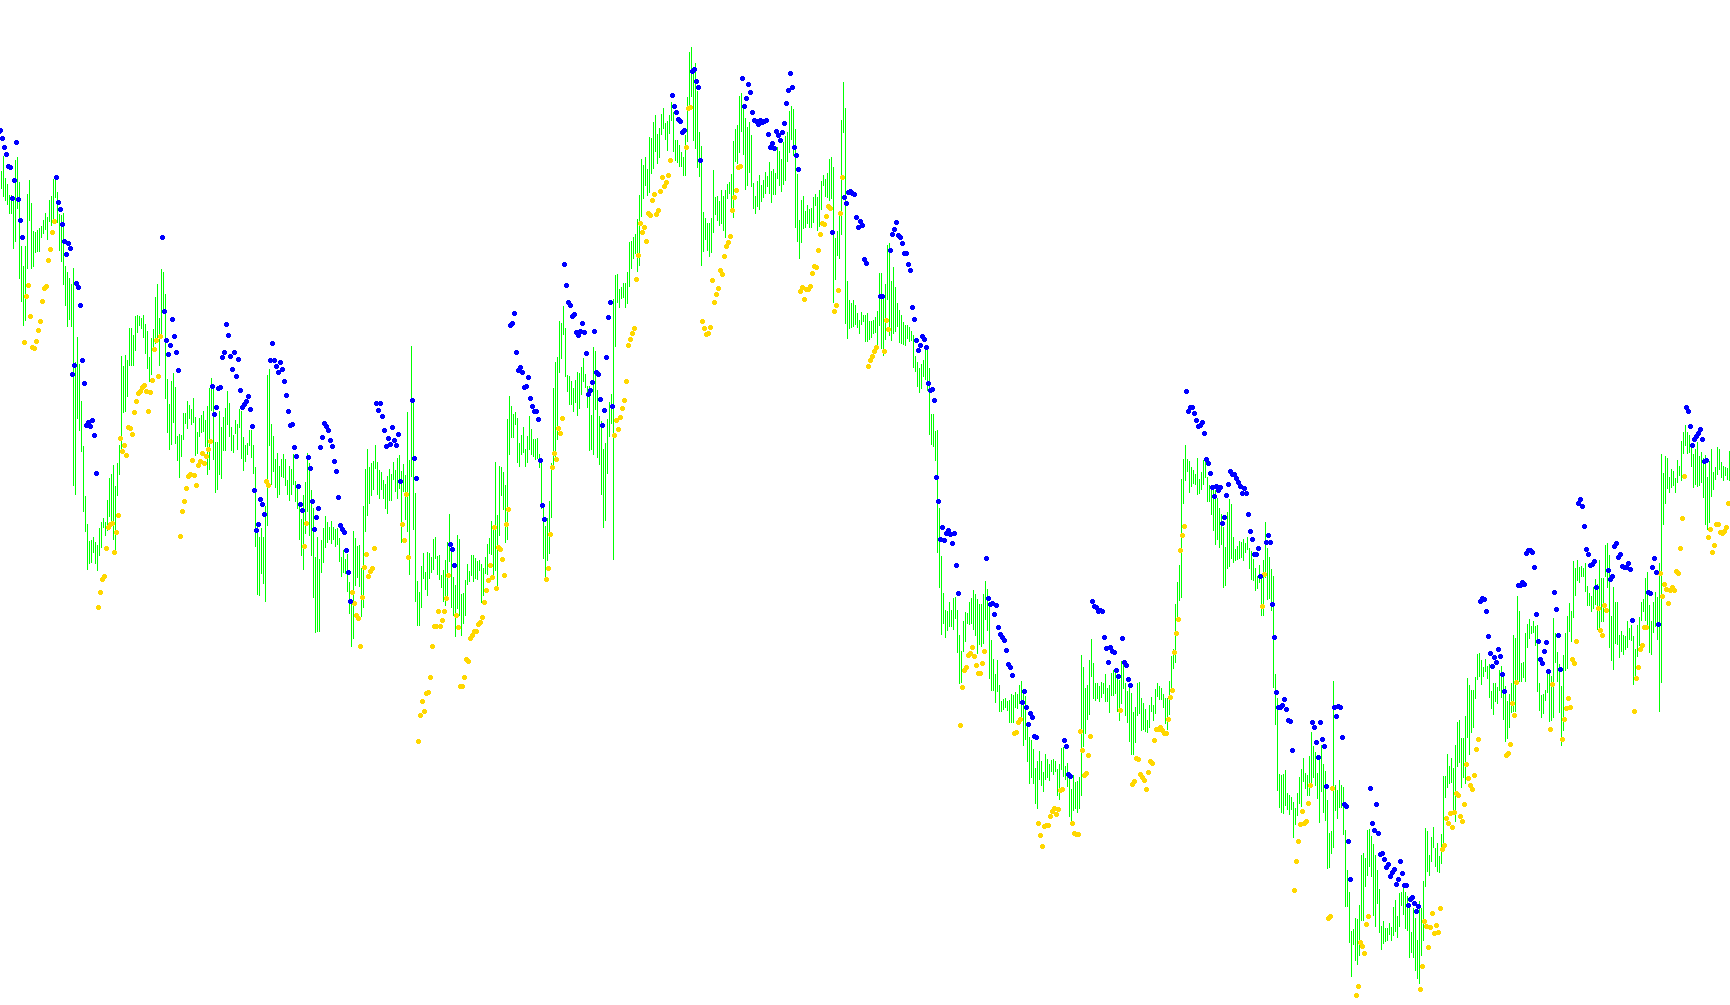
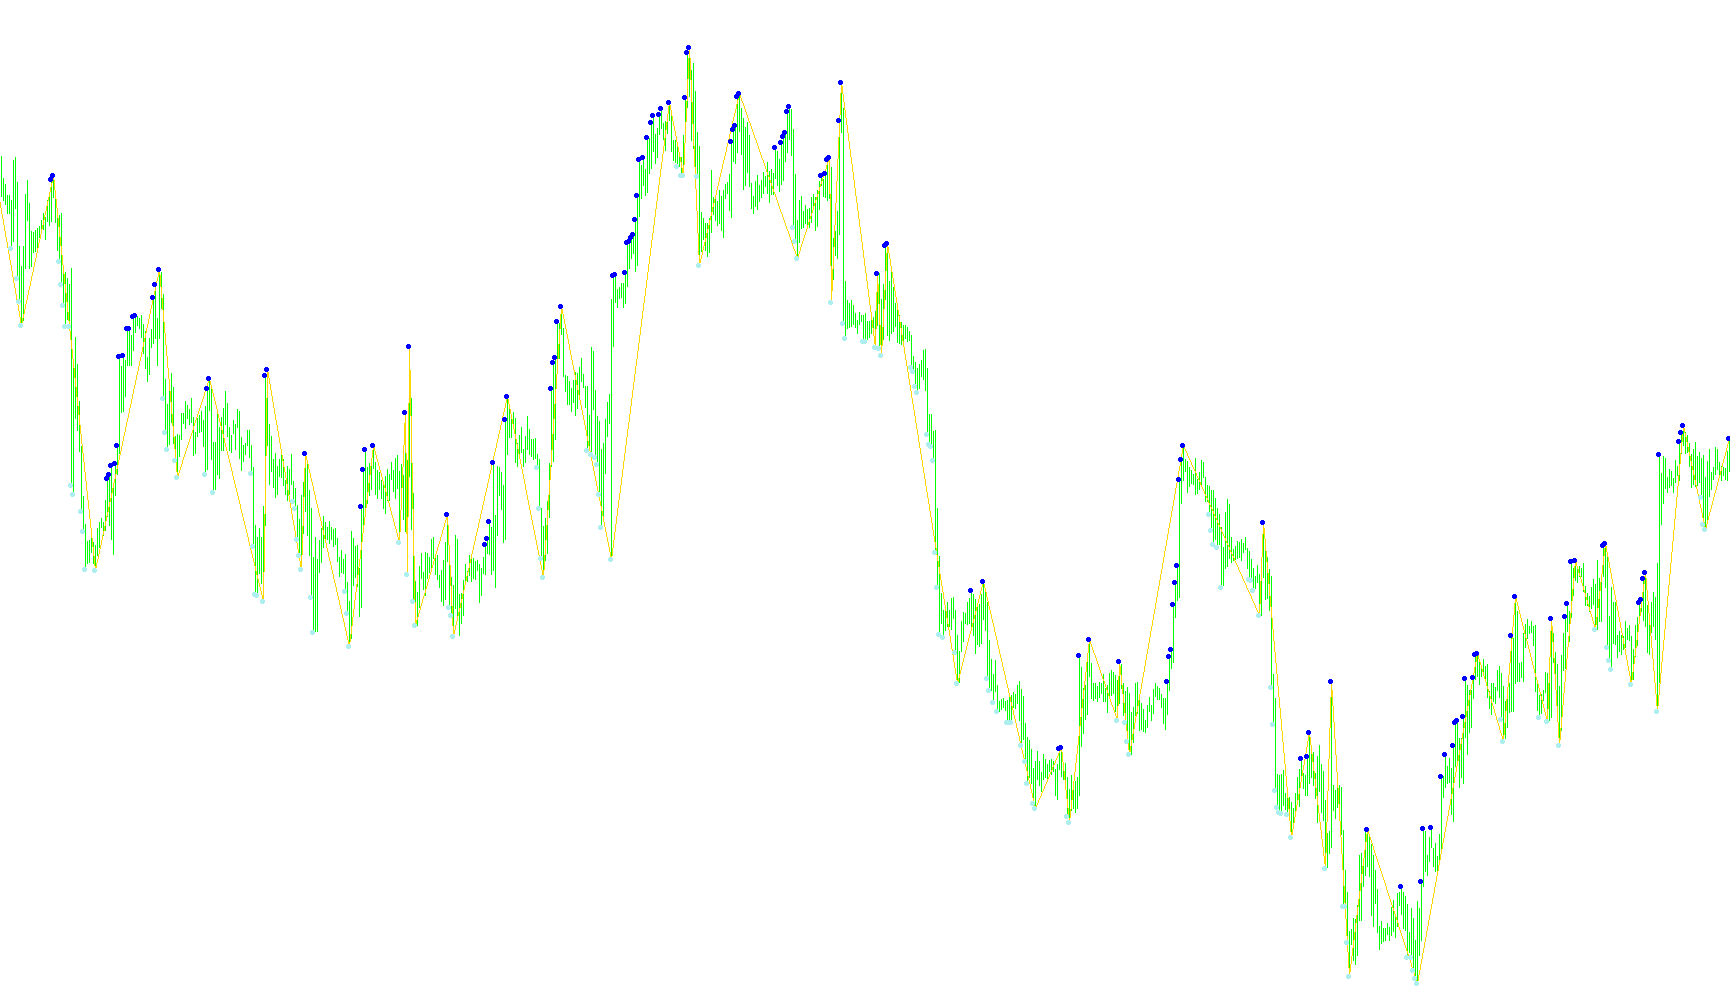
This indicator identifies price reversals by detecting ZigZag pivot points and projecting dynamic entry boundaries based on the Average True Range multiplier.

DT-ZigZag-ATR_v1
Indicator

DT-ZigZag-ATR_v1

iATR

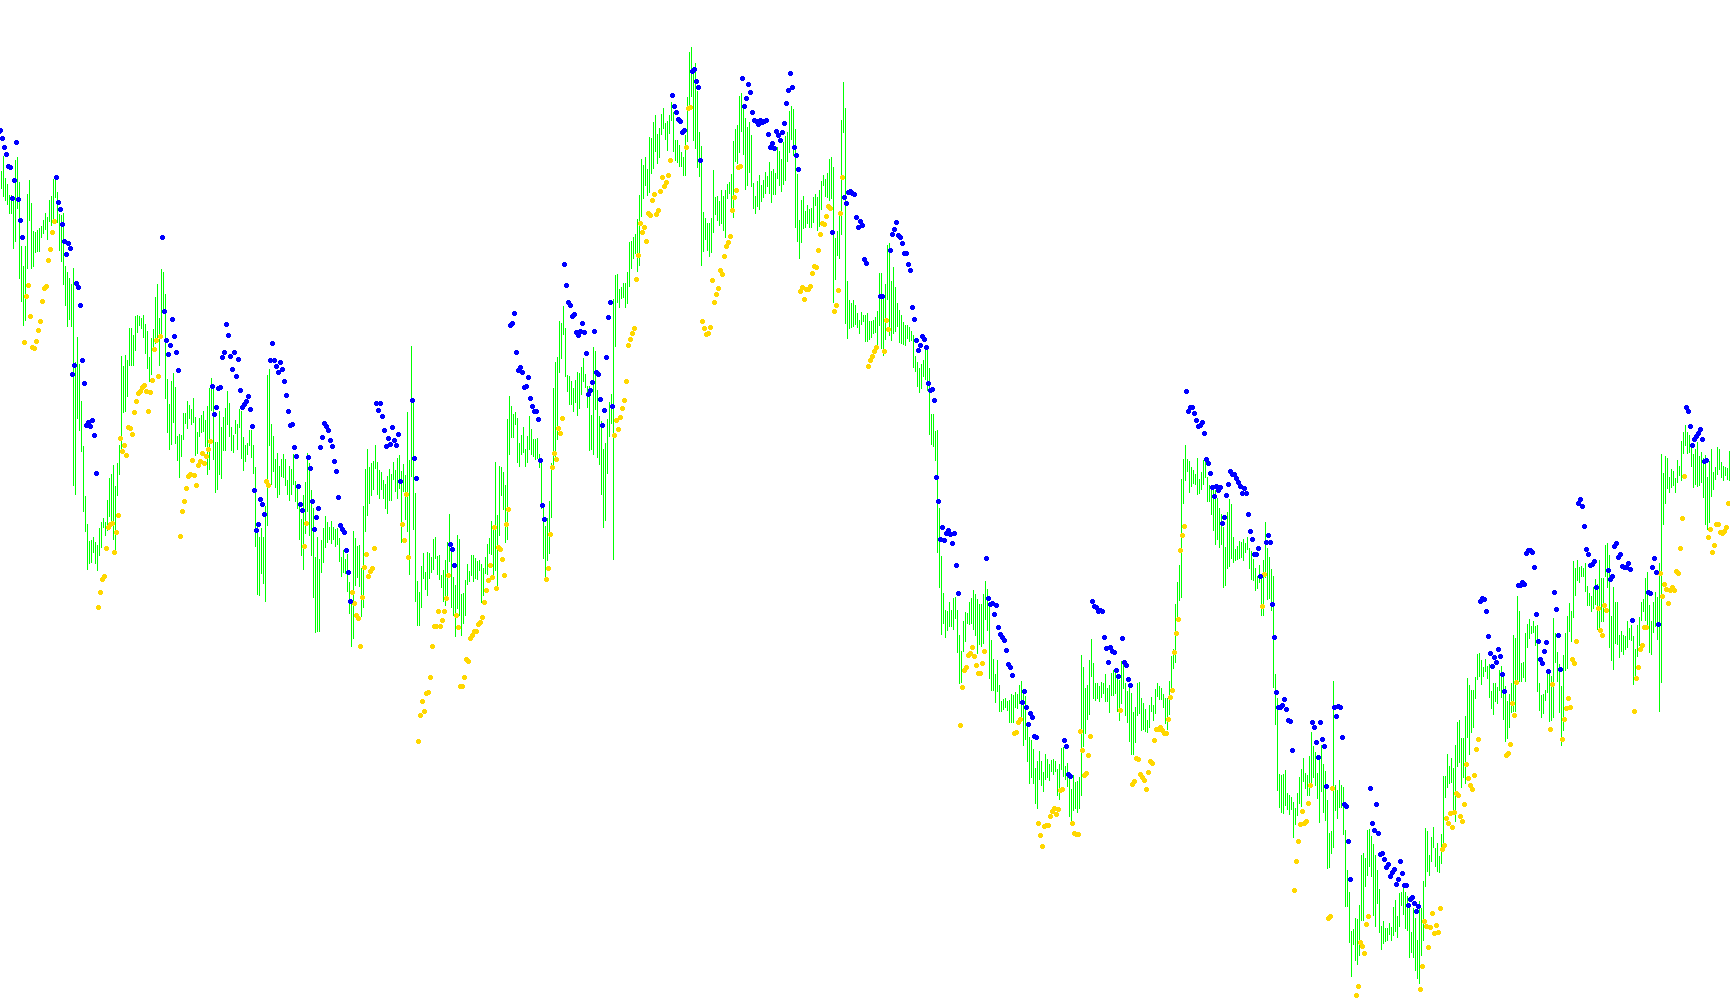
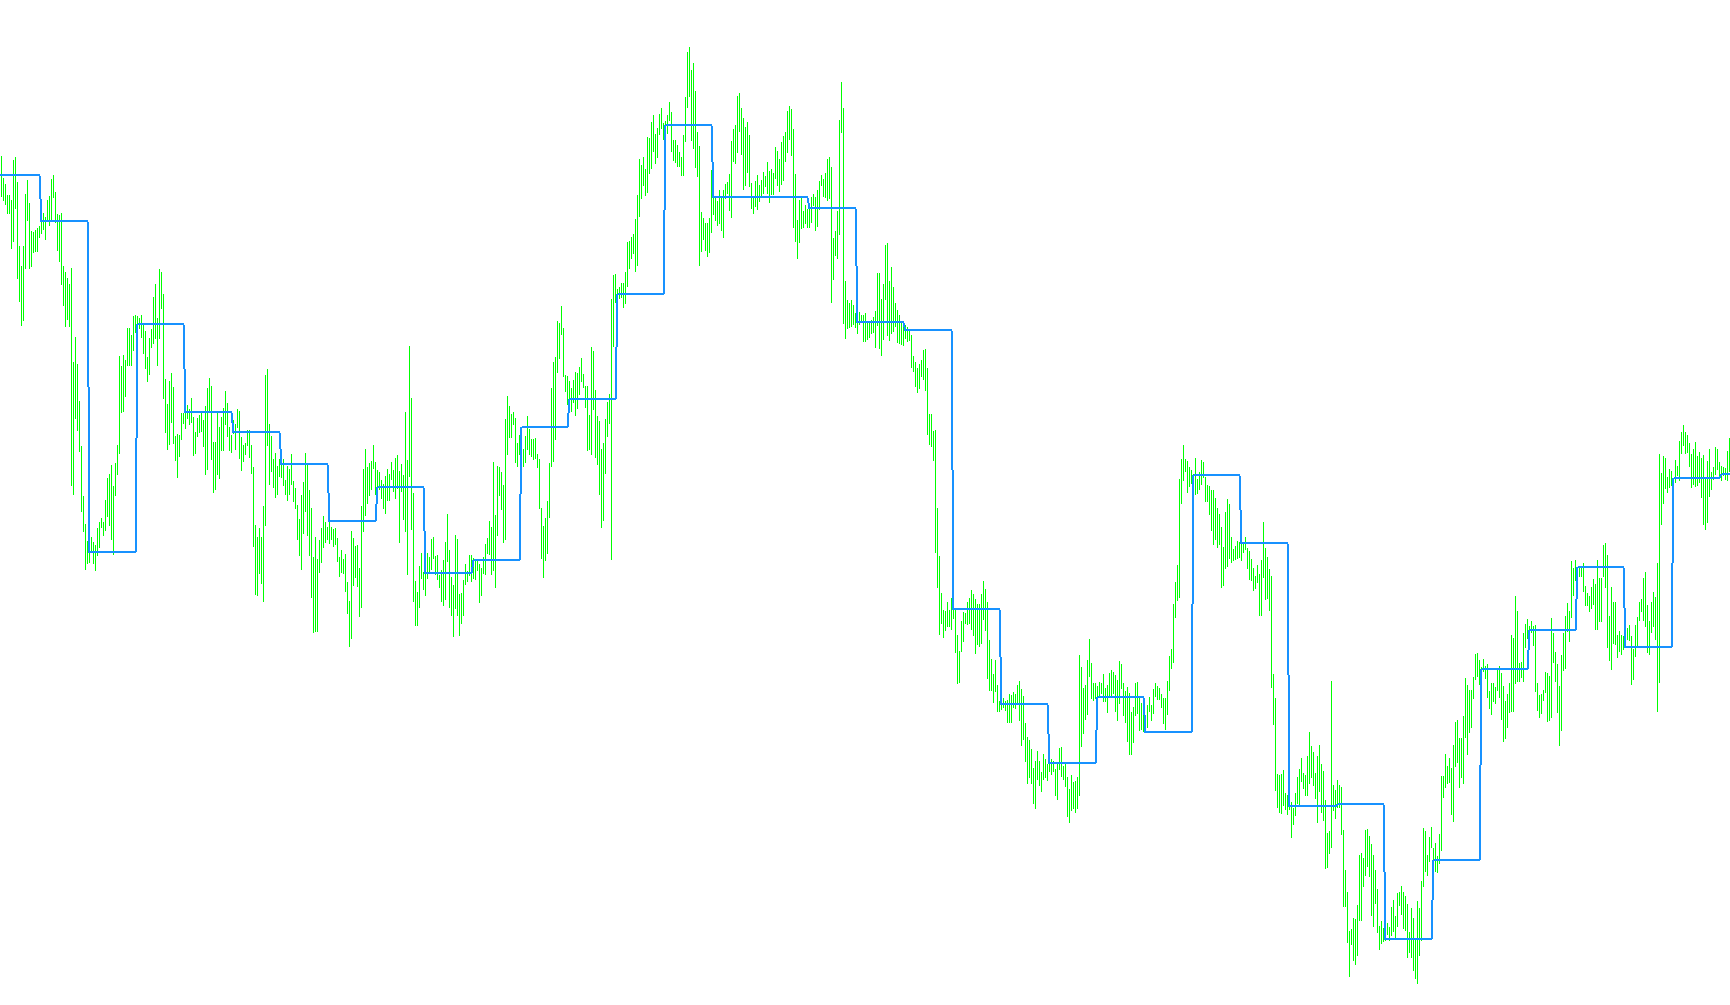
This indicator identifies structural pivot points using the standard ZigZag algorithm and projects dynamic support and resistance levels based on a volatility-weighted Average True Range multiplier.

DT-ZigZag-ATR_v2
Indicator

DT-ZigZag-ATR_v2

iATR

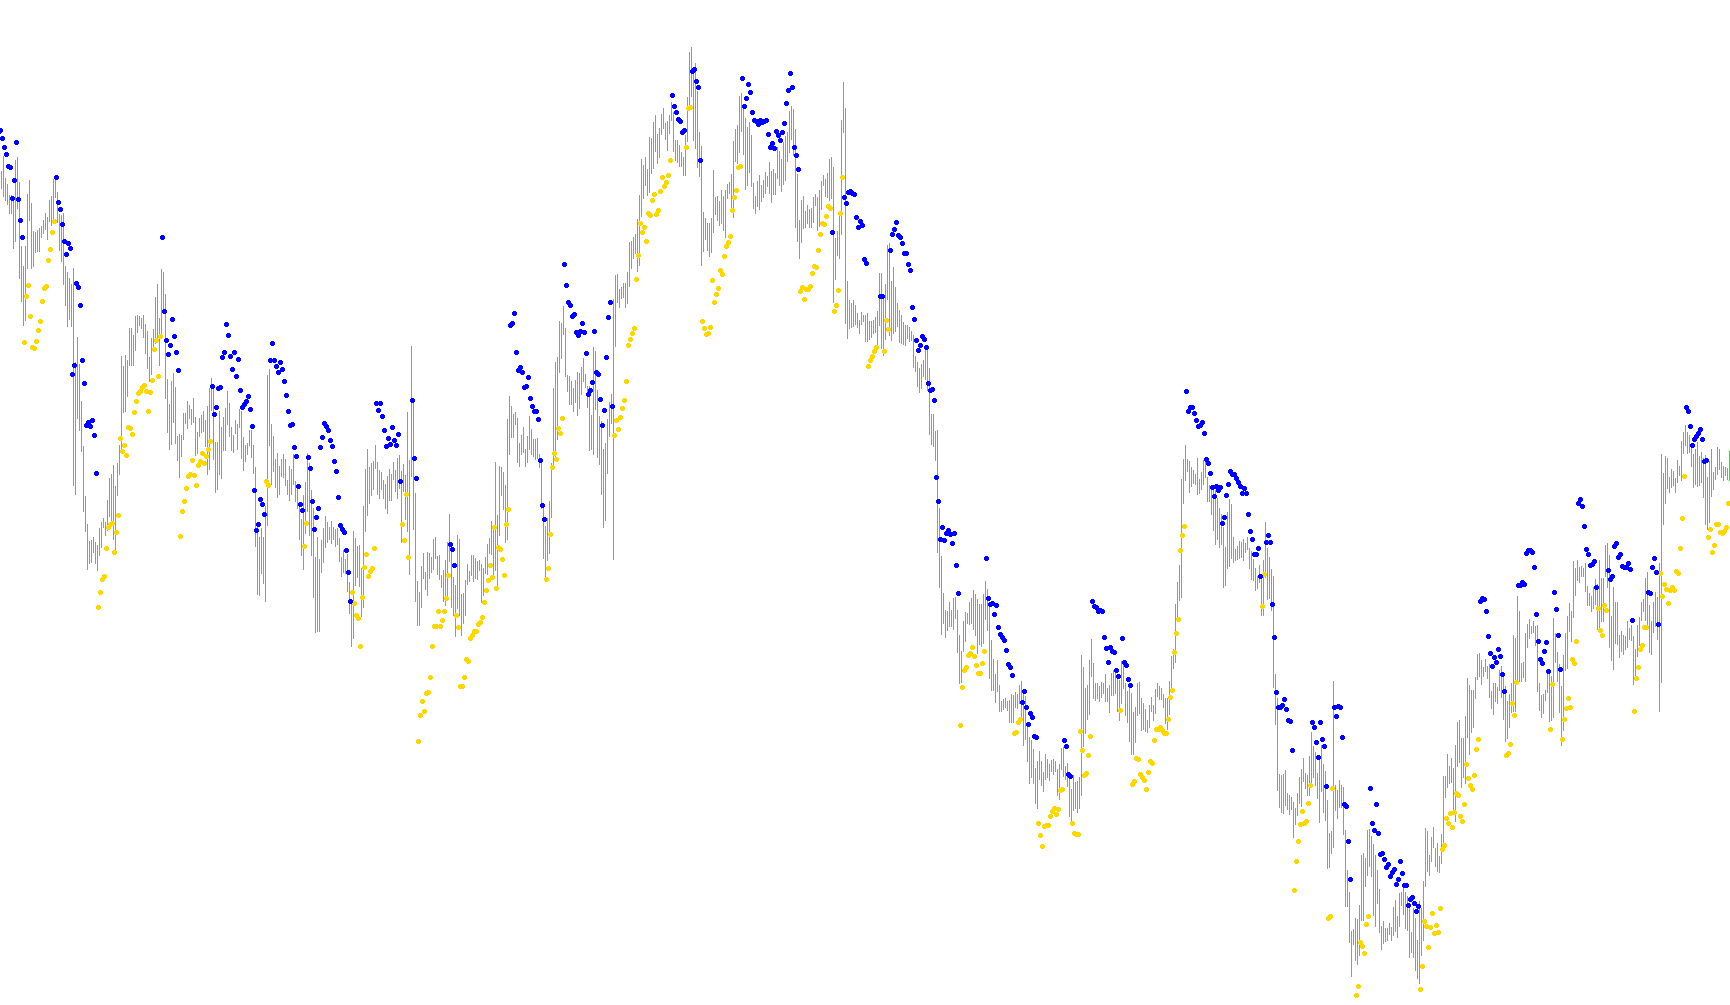
Identifies structural price pivot points by dynamically calculating distance from ZigZag peaks using a multiplier of the Average True Range.

DT-ZigZag-Lauer
Indicator

DT-ZigZag-Lauer

Identifies key structural pivot points by mapping higher timeframe ZigZag extrema onto lower timeframe price action to detect trend violations.

DT-ZigZag-Lauer_v1
Indicator

DT-ZigZag-Lauer_v1

The indicator identifies historical price pivots by mapping the standard ZigZag values from a higher timeframe onto the current chart to highlight structural reversals.

DT-ZigZag-Lauer_v2
Indicator

DT-ZigZag-Lauer_v2

This indicator identifies structural trend pivots by mapping high-period ZigZag extremes onto the current chart to filter price action relative to macro market swings.

DT-ZigZag
Indicator

DT-ZigZag

This indicator projects high-period ZigZag structural pivots onto the current chart by dynamically calculating temporal offsets based on a defined gross period.

DT-ZigZag_002
Indicator

DT-ZigZag_002

This indicator dynamically maps and visualizes high-timeframe ZigZag trend structures onto lower timeframes by calculating relative temporal shifts.

DT-ZigZag_006
Indicator

DT-ZigZag_006

This indicator dynamically projects and aligns structural high-low pivots from a higher timeframe onto the current chart by calculating specific temporal offsets.

DT-ZigZag_v1
Indicator

DT-ZigZag_v1

This indicator synchronizes and projects high-level price structure points from a larger timeframe onto the current chart using a dynamic temporal offset.
DT-ZigZag_v3
Indicator

DT-ZigZag_v3

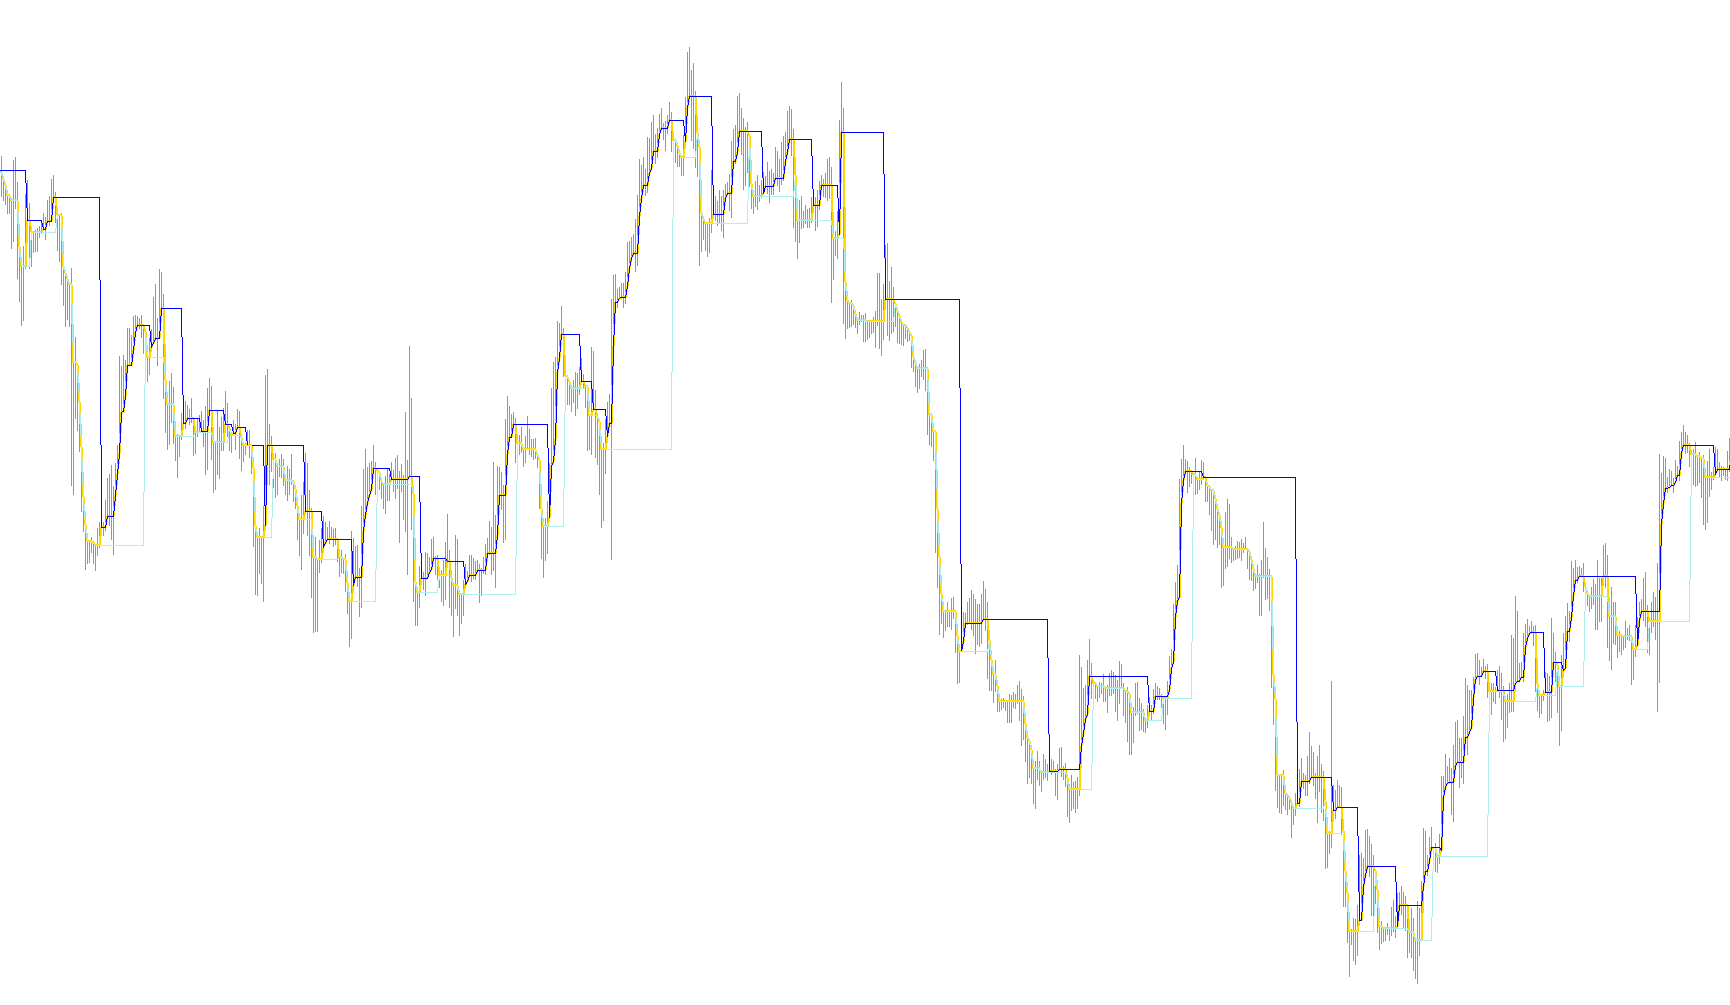
This indicator retrieves and projects high-level ZigZag structural points onto a lower timeframe by calculating the corresponding index shift based on a predefined period threshold.
DT-ZZ-M1
Indicator

DT-ZZ-M1

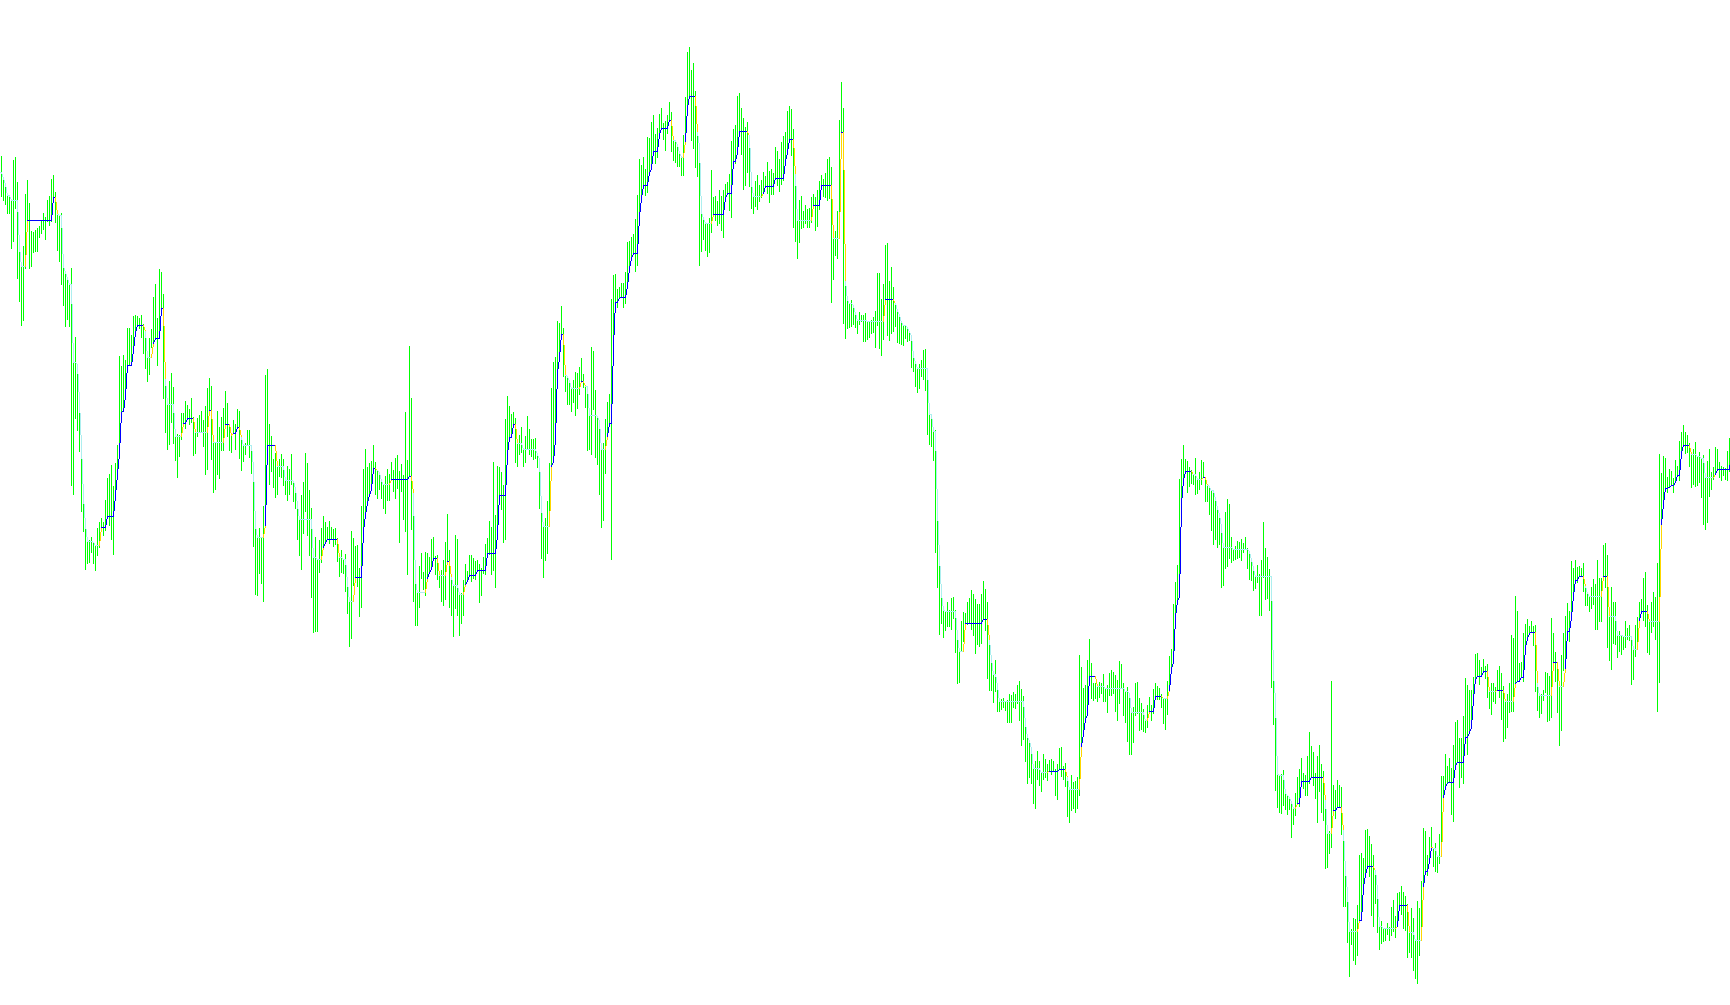
This indicator identifies structural trend shifts by comparing current price action against multi-timeframe ZigZag pivot points to detect momentum exhaustion.

DTM
Indicator

DTM

This indicator quantifies market velocity by calculating the divergence between two distinct sets of weighted linear combinations of historical price data.

Indicator

DTosc_mtf_

iMAOnArrayiRSI
Indicator

DTosc_yb_mtf_

iMAOnArrayiRSI
DTS-Ang_AutoCh_HL-v2
Indicator

DTS-Ang_AutoCh_HL-v2

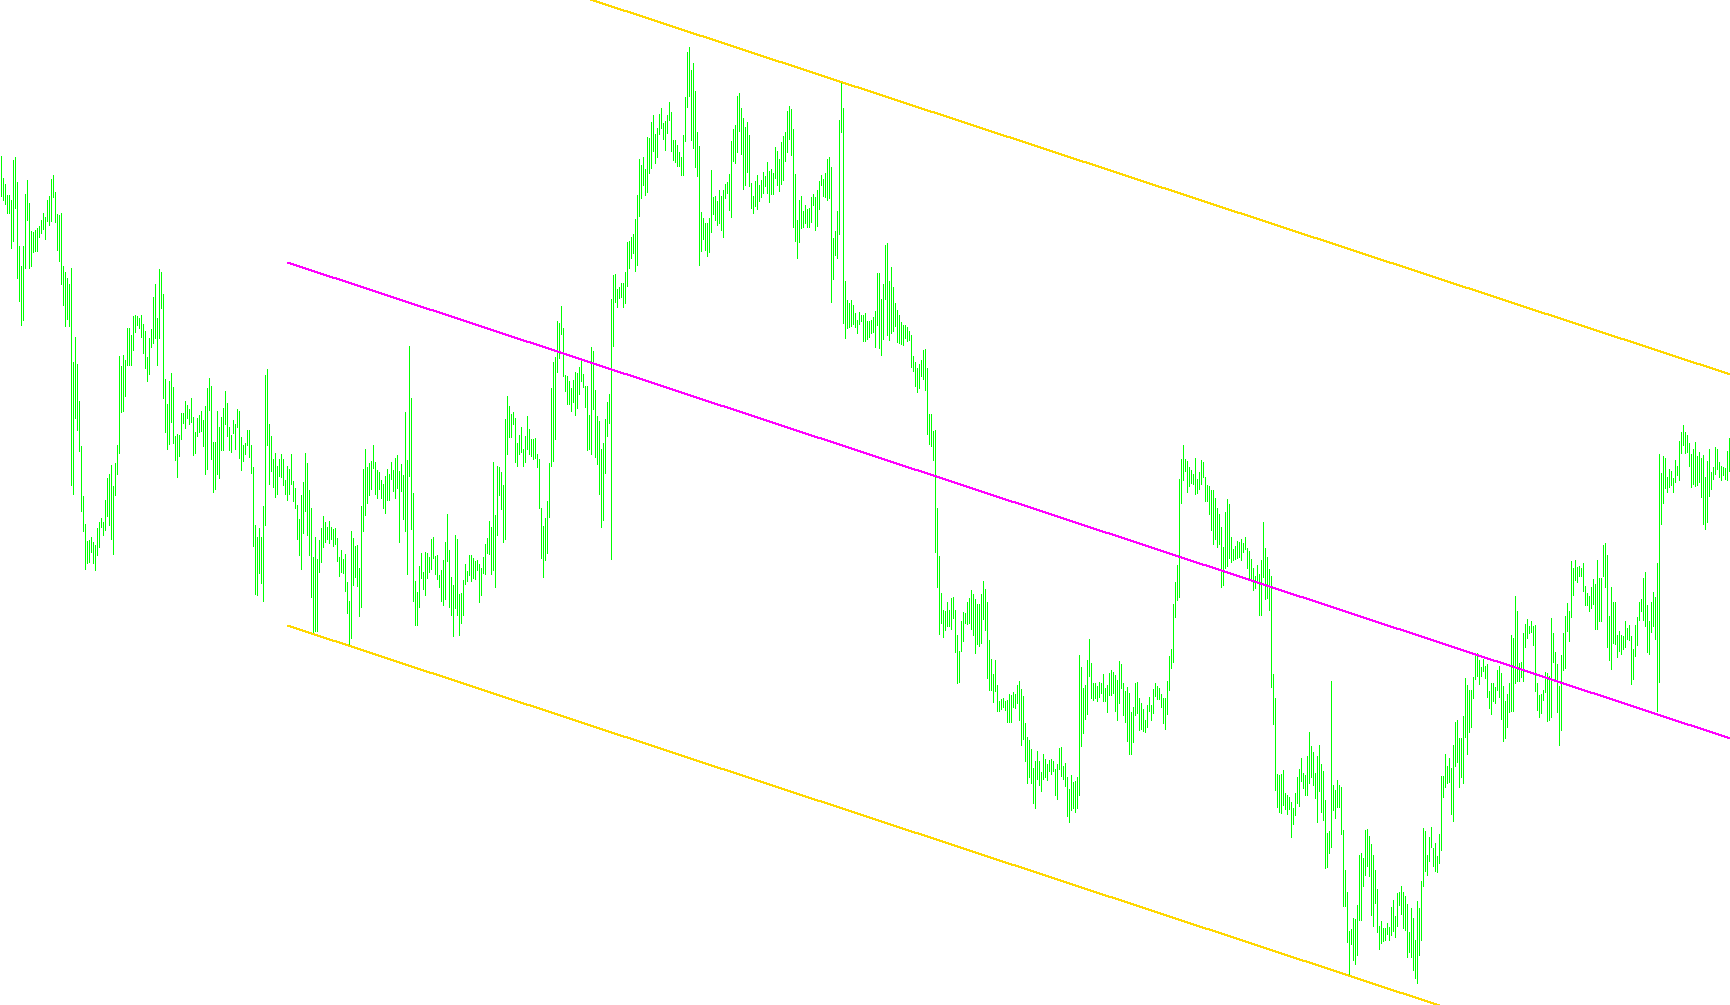
This indicator utilizes linear regression analysis to project dynamic upper, median, and lower boundary channels based on historical price volatility.

Indicator

DTS-Clock_v1_2

DTS-Dolly_Trading Times #3
Indicator

DTS-Dolly_Trading Times #3

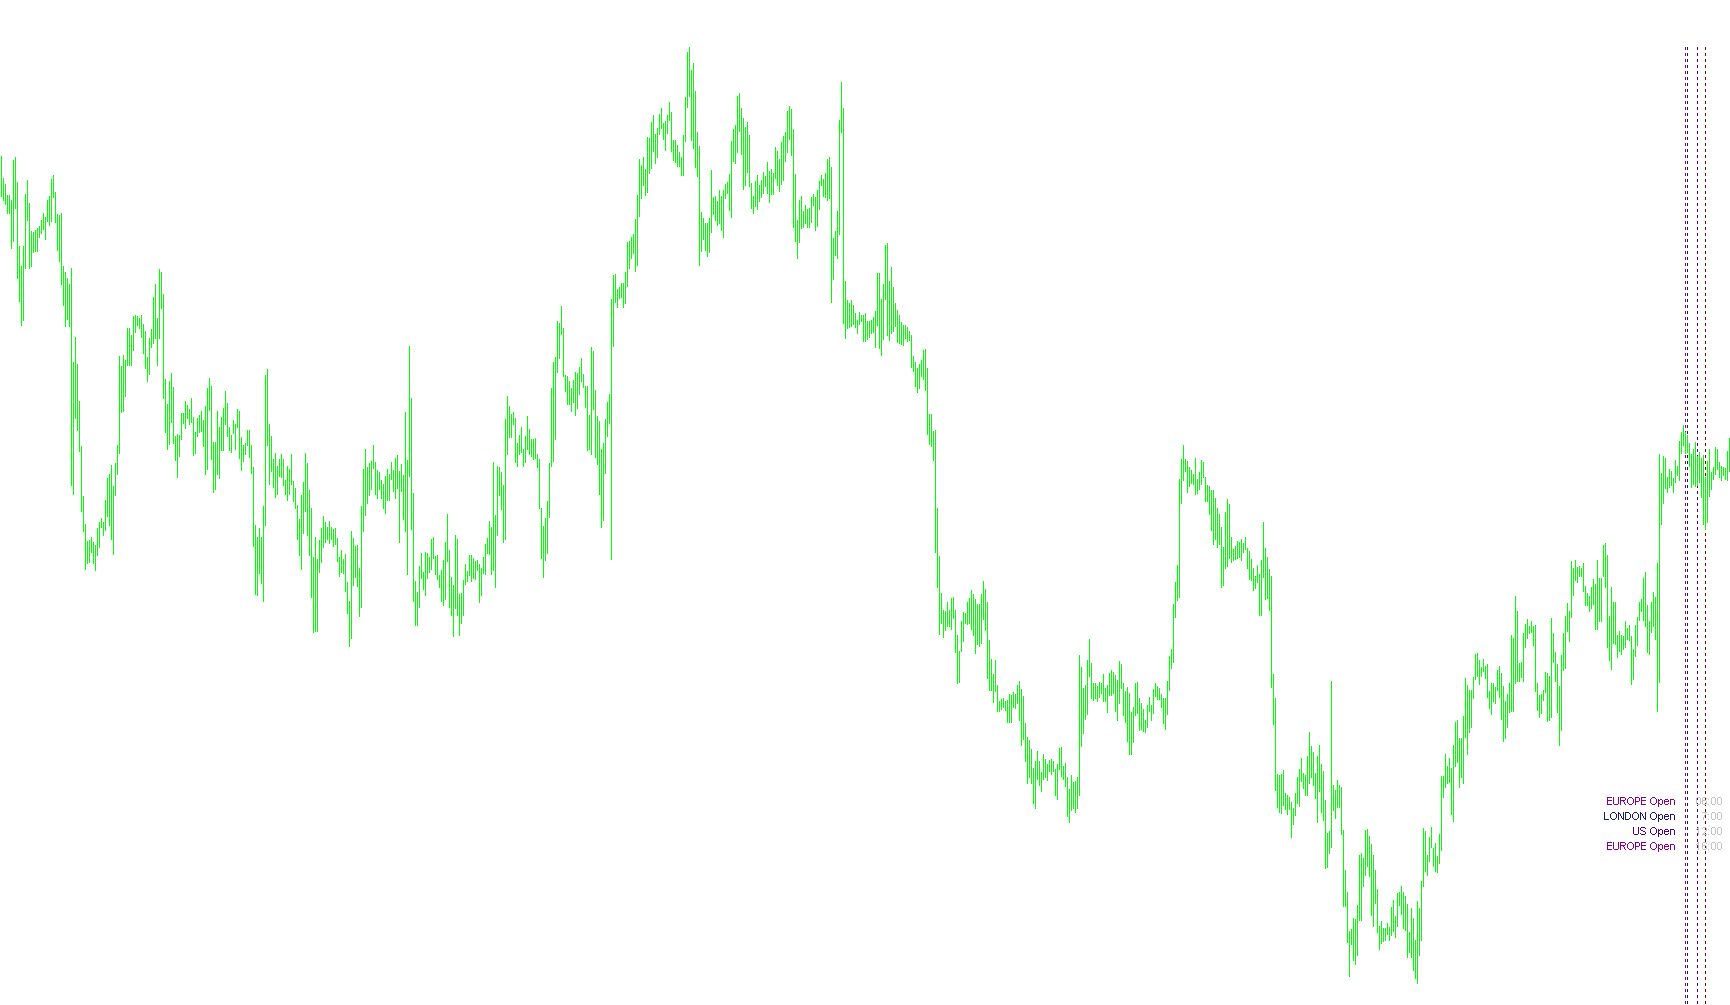
This indicator visually plots high and low price boundaries for key global market open and close times across multiple trading days.

Indicator

DTS-Fractales

DTS-InfoTrade
Indicator

DTS-InfoTrade

iCCIiMACDiRSIiStochastic

This indicator aggregates MACD, RSI, Stochastic, and CCI data across multiple timeframes to provide a real-time visual heatmap of trend sentiment and volatility metrics.

DTS-Monta§a
Indicator

DTS-Monta§a

iMAOnArray

This indicator identifies trend reversals by applying a logarithmic transformation to normalized price positions relative to local high-low extremes.

DTS-SHI_Channel_MTF
Indicator

DTS-SHI_Channel_MTF

This indicator identifies local price extremes using fractal-based logic to construct a multi-timeframe trend channel with calculated slope and dynamic price boundaries.

DT_ZZ
Indicator

DT_ZZ

The algorithm identifies market structure by tracking local extrema and highlighting significant price reversals where subsequent highs or lows breach previous structural pivots.

DT_ZZ_001
Indicator

DT_ZZ_001

This indicator identifies significant structural price pivot points by tracking local extremes within a user-defined depth to filter out minor market noise.

DT_ZZ_004
Indicator

DT_ZZ_004

This indicator identifies structural reversals by detecting nested local extrema and projecting pivot points where price action breaks previous polarity thresholds.

DT_ZZ_Impuls_Slope
Indicator

DT_ZZ_Impuls_Slope

This indicator calculates the instantaneous velocity of price movement by mapping price displacement relative to time into an angular trajectory.

DT_ZZ_SupRes
Indicator

DT_ZZ_SupRes

This indicator identifies historical price extremes to establish static support and resistance levels while visually highlighting structural trend ruptures.

DT_ZZ_v2
Indicator

DT_ZZ_v2

This indicator identifies structural market swings by detecting local extrema and plotting significant price reversals through a recursive peak-to-trough filtering mechanism.

DUR
Indicator

DUR

This indicator calculates and plots structural support, resistance, and pivot levels based on customizable price point aggregations like HLCC, HLC, or standard high-low ranges.

DYNAMIC Breakout Daily Range_v10
Indicator

DYNAMIC Breakout Daily Range_v10

This indicator calculates multi-period daily high-low ranges to determine mean volatility and projects potential price expansion boundaries for risk-adjusted trade positioning.

Dynamic trend cleaned up
Indicator

Dynamic trend cleaned up

Identifies trend reversals by detecting price breaches of a fluctuating boundary calculated from periodic highs and lows adjusted by a fixed percentage offset.

Indicator

Dynamic trend

Dynamic Zone RSI
Indicator

Dynamic Zone RSI

iRSI

This indicator identifies extreme price momentum by overlaying dynamic standard deviation bands onto a Relative Strength Index to highlight statistical overextensions.

Dynamic Zone RSI1(02SEP05)
Indicator

Dynamic Zone RSI1(02SEP05)

iRSI

This indicator generates a dynamic volatility envelope around the Relative Strength Index by calculating a moving average and standard deviation of the momentum values.

Dynamic Zone RSI2
Indicator

Dynamic Zone RSI2

iRSI

This indicator overlays a dynamically expanding and contracting volatility band around the Relative Strength Index by calculating standard deviation offsets from a moving average.

Dynamic Zone RSI_v1
Indicator

Dynamic Zone RSI_v1

iRSI

This indicator overlays a dynamic volatility band around the Relative Strength Index by calculating moving averages and standard deviations to identify overextended price momentum.

Dynamic Zone RSI_v2
Indicator

Dynamic Zone RSI_v2

iRSI

The indicator projects dynamic volatility boundaries around a Relative Strength Index line by calculating a moving average and standard deviation offset.

dynamic-W-Sound
Indicator

dynamic-W-Sound

This indicator identifies trend reversals by monitoring price breaches of a dynamic high-low boundary that recalibrates based on historical extrema.

dynamic
Indicator

dynamic

This indicator identifies trend reversals by calculating a dynamic price channel based on historical high-low extremes and signaling entries upon price crossovers.

DynamicRS+Channel
Indicator

DynamicRS+Channel

The algorithm identifies significant structural pivots by filtering minor price fluctuations to construct a dynamic volatility corridor.

DynamicRS
Indicator

DynamicRS

iMAOnArray

The logic identifies structural supply and demand zones by capturing extreme price pivots triggered by the momentum crossover of a weighted average price basis against its simple moving average.

DynamicRS_3CLines
Indicator

DynamicRS_3CLines

This indicator dynamically maps price extremes by locking and shifting boundaries based on sequential high and low breach conditions.

Indicator

DynamicRS_3CLinesM_mtf

DynamicRS_C
Indicator

DynamicRS_C

This indicator identifies structural market shifts by tracking consecutive price extremes to detect momentum exhaustion and trend reversals.

Indicator

DynamicRS_Channel_mtf

DynamicRS_v1
Indicator

DynamicRS_v1

iMAOnArray

This indicator identifies structural price boundaries by capturing historical extremes at the precise moment weighted price momentum crosses its moving average.

DynamicRS_v2
Indicator

DynamicRS_v2

The logic identifies relative price extrema by recursively filtering local highs and lows against a historical period to map significant structural pivot points.

DynamicZoneRSI
Indicator

DynamicZoneRSI

iRSI

This indicator identifies overextended price action by overlaying a standard deviation-based dynamic envelope onto a weighted relative strength index.

DynamicZoneRSI_001
Indicator

DynamicZoneRSI_001

iRSI

This indicator overlays a Bollinger Band-inspired volatility envelope and an Exponential Moving Average onto the Relative Strength Index to identify overextended momentum extremes.