Ehlers_iTrend
Download script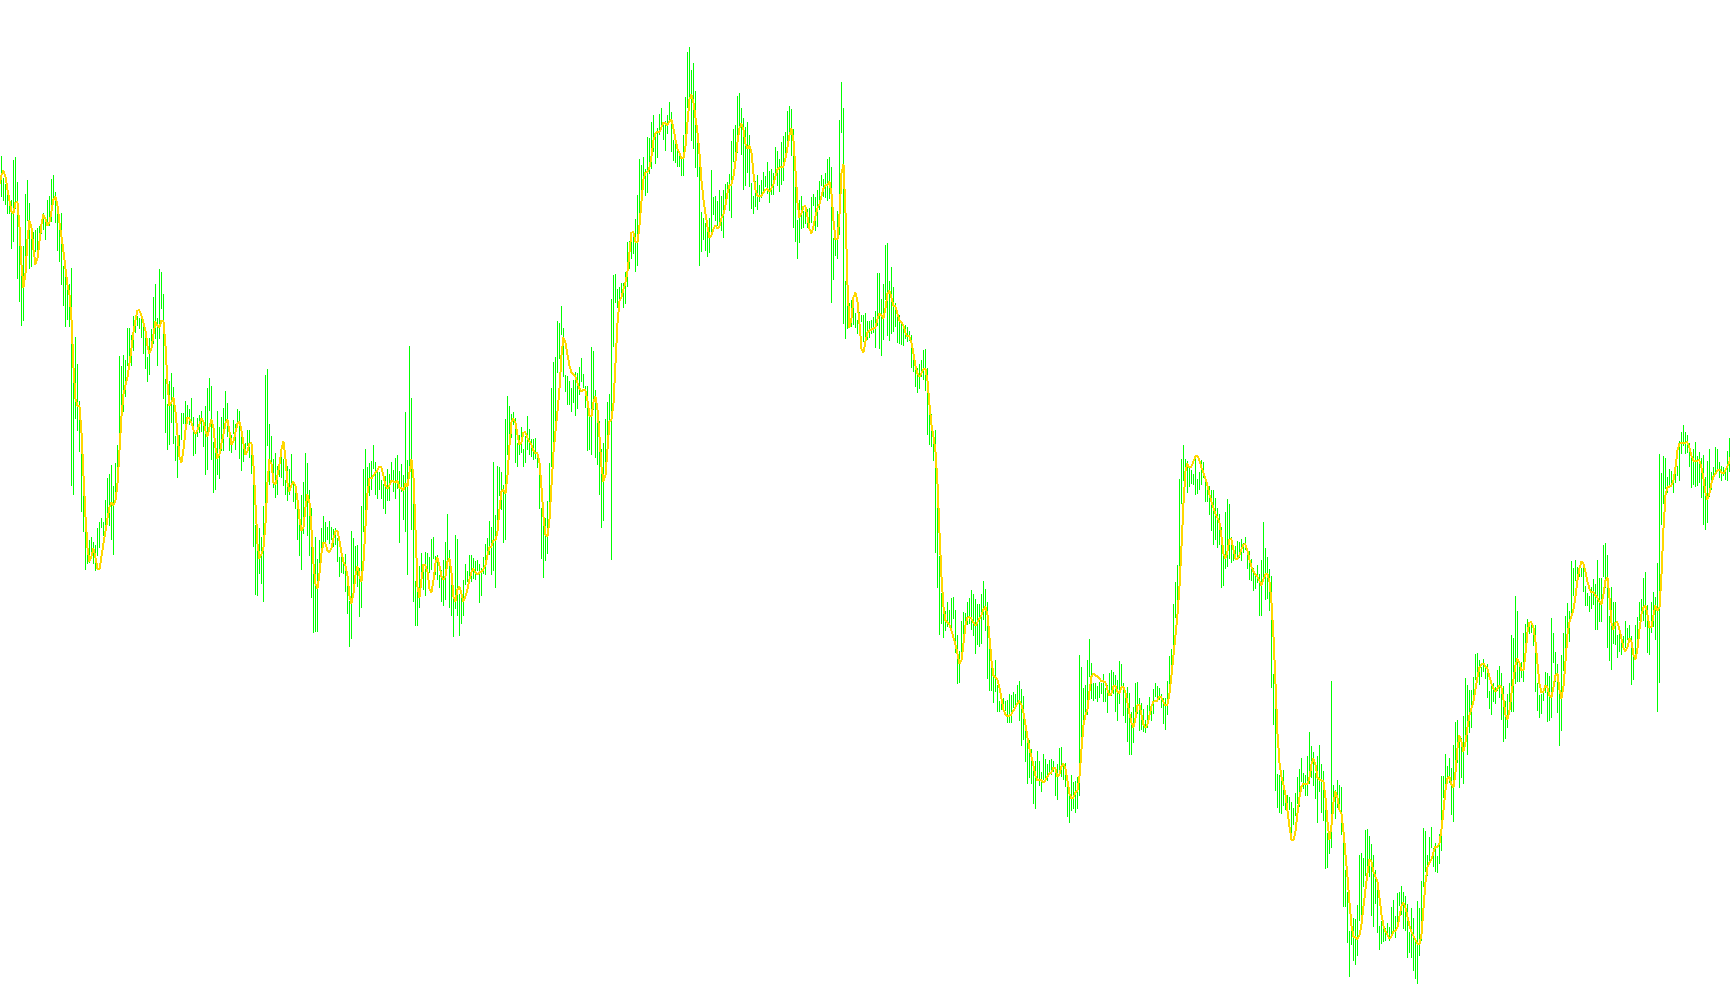
The Ehlers iTrend is a specialized technical analysis tool designed to provide traders with a clearer visual representation of market trends. Rather than simply following the raw price movement, which can often be "noisy" or erratic, this script uses advanced mathematical smoothing and component analysis to identify the underlying direction of the market.
How the Logic Works
The indicator functions by breaking down the price action into three distinct components to create a more reliable trend line:
1. Price Averaging The tool begins by establishing a baseline using the midpoint of each price candle (the average of the high and low). This helps filter out minor price spikes that occur within a single time period.
2. The Instantaneous Trend Component To understand where the trend is heading, the script performs two specific calculations:
- Simple Moving Average: It calculates a standard average over a user-defined period to provide a steady baseline.
- Slope Analysis: It measures the "tilt" or velocity of the price change. By smoothing this slope and combining it with the moving average, the tool creates an "Instantaneous Trend." This reflects the immediate momentum of the current market move.
3. The Cyclic Component (The "Ehlers" Signature) This is what distinguishes this indicator from a standard moving average. It identifies cycles—the recurring ups and downs in market behavior.
- It uses a specific coefficient (Alpha) to calculate a "High Pass" filter.
- This filter isolates the cyclical fluctuations of the price.
- By smoothing these cycles and adding them back into the trend calculation, the indicator can better account for repetitive market behaviors that might otherwise cause a standard moving average to lag or give false signals.
Final Output
The final line you see on your chart (the TREND line) is the sum of these parts:
Trend Line = Instantaneous Trend + Smoothed Cyclic Component
By combining the immediate momentum of the price with the mathematical smoothing of cyclical movements, the Ehlers iTrend aims to provide a smoother, more responsive trend visualization that helps traders stay aligned with the primary market direction while filtering out unnecessary market noise.
//+------------------------------------------------------------------+
//|                                                Ehlers iTrend.mq4 |
//|                      Copyright © 2006, MetaQuotes Software Corp. |
//|                                        http://www.metaquotes.net |
//+------------------------------------------------------------------+
// new coding attempt below:
//Model Ehler's iTrend.mq4, for Metatrader 4, 13 August 2006
//  - this custom indicator plots an interesting TREND line
// on a chart
//this initial 'beta' version appears to 'work' -
// but every user should check it out before using it -
// this code below may still have unknown bugs?
// 'use at your own risk'  please post suggestions for
// corrections and improvements to this code (.MQ4)
// - 'Bill_gigi' on YAHOO 'MetaTrader_Experts_and_Indicators'

#property indicator_chart_window
#property indicator_buffers 1
#property indicator_color1 Orange   // DodgerBlue
//---- input parameters
extern int Length=10;
//---- buffers
double TREND[];  // otherwise called "Model" by Ehlers
double iTrend[];
double Price[];
double Slope[];
double HP[];
//---- Varibles
int j, i, n, counted_bars, limit, totalBars;
double SMA=0.0, SmoothSlope=0.0, twopi=6.2831853, X=0.0;
double Alpha=0.0, SmoothHP=0.0, Prev = 0.0;

// Custom indicator initialization function
int init()
 {
  string short_name;
//----  additional buffers used
  IndicatorBuffers(5);
//---- indicator line
  SetIndexStyle(0, DRAW_LINE, STYLE_SOLID, 2);
  SetIndexBuffer(0,TREND);
  SetIndexBuffer(1,iTrend);
  SetIndexBuffer(2,Price);
  SetIndexBuffer(3,Slope);
  SetIndexBuffer(4,HP);
//---- name for DataWindow and indicator subwindow label
  short_name="TREND("+Length+")";
  IndicatorShortName(short_name);
  SetIndexLabel(0,short_name);
//----
//   SetIndexDrawBegin(0,Length);
//----
  return(0);
 }
//+------------------------------------------------------------------+
int start()
 {
   counted_bars=IndicatorCounted();
   totalBars = Bars;
//----
  if(totalBars<=Length) return(0);
  Alpha = (1 - MathSin(twopi/Length)) / MathCos(twopi/Length);

  i=totalBars-counted_bars-1;
  while(i>=0)
      {

          if(i >= (totalBars - Length))
           {
             Price[i] = (High[i] + Low[i])/2;
             TREND[i] = 0.0;
             SMA = 0.0;
             HP[i] = 0.0;
             Slope[i] = 0.0;
           }
          else
            {
              Price[i] = (High[i] + Low[i])/2;
              X = 0.0;
              for(j = Length-1; j > -1; j--)
               {
                X = X + Price[i+j];
               }
              SMA = X/Length;

                // below compute iTrend[i] ~ "instantaneous Trend Line" component of the Model trend
               Slope[i] = (Price[i] - Price[i + Length - 1])/2.0;
               SmoothSlope = (Slope[i] + 2.0*Slope[i+1]+ 2.0*Slope
[i+2] + Slope[i+3])/6.0;
               iTrend[i] =  (0.5 * SmoothSlope) + SMA;

               // below is code for the Ehler's 'Cyclic Component'
               HP[i] = 0.5*(1+Alpha)* (Price[i] - Price[i+1]) +
Alpha*HP[i+1];
               SmoothHP = (HP[i] + 2.0*HP[i+1] + 2.0*HP[i+2] + HP
[i+3])/6.0;

             }  // end of above 'else' condition


         TREND[i] = iTrend[i] + SmoothHP;

        i--;

     }  // end of 'while' loop

   return(0);
 }
Comments