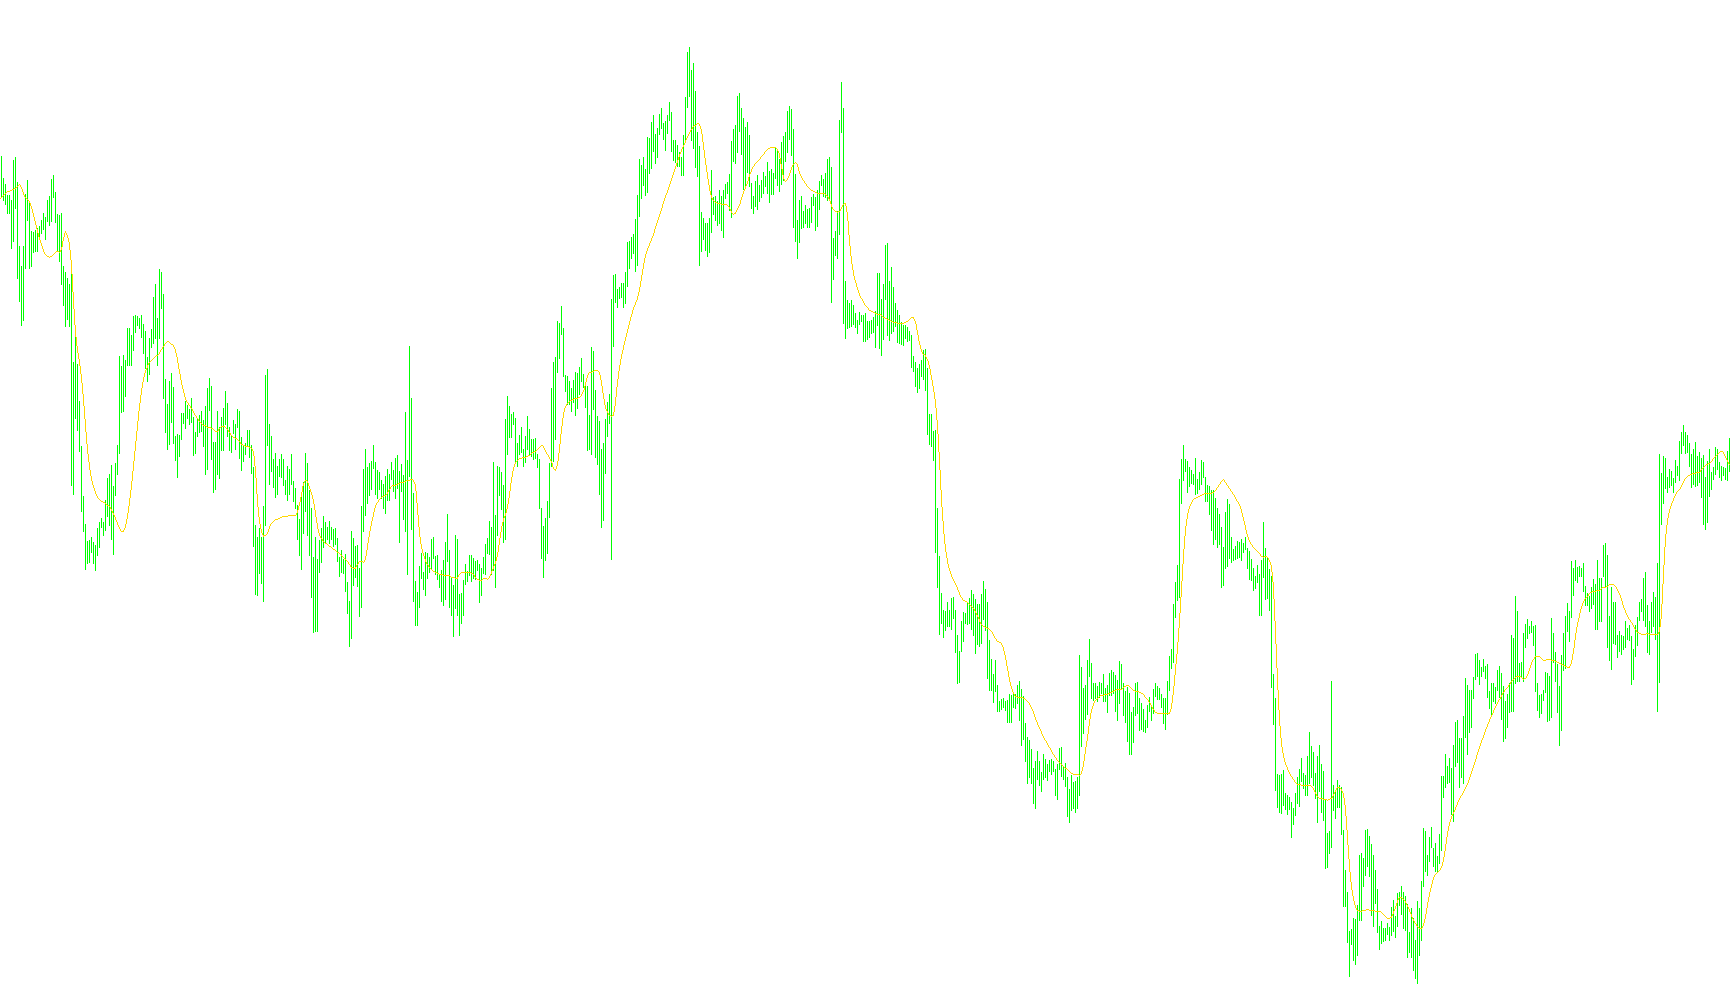
This tool is designed as a technical analysis indicator for trading platforms. Its primary purpose is to provide a filtered view of price action by smoothing out market "noise" while attempting to maintain the integrity of the underlying price movement.
How the Logic Works
The script operates through a multi-stage mathematical process to transform raw price data into a refined trend line:
1. Price Smoothing The first step involves calculating a weighted average of recent closing prices. Rather than treating every price point equally, the logic applies specific weights to the most recent candles compared to those slightly further back. This creates an initial "smooth" version of the price, reducing the impact of minor, erratic fluctuations.
2. Variance and Distance Calculation The core of this indicator lies in how it handles "distance." The script looks back over a user-defined period (set by the Length parameter) to measure the relationship between different points in time. It calculates a squared distance between price points, which essentially helps the tool understand how much the price is moving relative to its own history.
3. Coefficient Mapping Using these distance measurements, the script generates a unique coefficient for every point within the lookback period. These coefficients act like importance weights; they help determine which historical data points are most relevant to the current price trend.
4. Weighted Result Generation In the final stage, the indicator combines the smoothed prices with the calculated coefficients. It calculates a weighted average where the influence of each price point is adjusted by its corresponding coefficient. The final output is a single line plotted on your chart that represents a sophisticated, balanced view of the market's direction.
Summary for the User
Instead of simply following the price directly—which can be jumpy and misleading—this script looks at the history of the price to determine its momentum and "weight." It filters out the minor vibrations of the market to show you a clearer path of the actual trend, helping traders identify the broader direction of the asset more effectively.
// at the end of the file you'll find the Easy Language code


#property copyright ""
#property link      ""

#property indicator_chart_window
#property indicator_buffers 1
#property indicator_color1 Red

extern int  Length = 20;

int         ExtCountedBars=0;

double      smooth[];
double      coef[];
double      distance2[];
//---- buffers
double      ExtMapBuffer[];
//----
//+------------------------------------------------------------------+
//| Custom indicator initialization function                         |
//+------------------------------------------------------------------+
int init()
  {
   int    draw_begin;
   string short_name;

//---- drawing settings
   IndicatorBuffers(4);
   SetIndexStyle(0,DRAW_LINE);
   SetIndexShift(0,0);
   IndicatorDigits(MarketInfo(Symbol(),MODE_DIGITS));

   draw_begin=Length-1;
   short_name = "Ehlers(";
   IndicatorShortName(short_name+Length+")");
   SetIndexDrawBegin(0,draw_begin);
//---- indicator buffers mapping
   SetIndexBuffer(0,ExtMapBuffer);
   SetIndexBuffer(1, smooth);
   SetIndexBuffer(2, coef);
   SetIndexBuffer(3, distance2);
//---- initialization done
   return(0);
  }
//+------------------------------------------------------------------+
//|                                                                  |
//+------------------------------------------------------------------+
int start()
  {
   if(Bars<=Length) return(0);
   ExtCountedBars=IndicatorCounted();
//---- check for possible errors
   if (ExtCountedBars<0) return(-1);
//---- last counted bar will be recounted
   if (ExtCountedBars>0) ExtCountedBars--;
//----
   Ehlers();
   return(0);
  }

void Ehlers()
{
  int         count=0;
  int         lookback=0;
  double      sumcoef=0;
  double      num=0;
  int    pos=Bars-ExtCountedBars-1;
  int    pos2 = pos;
  if(pos2 > Bars-3) pos2 = Bars-3;
  while(pos2>=0)
  {
     smooth[pos2]=(Close[pos2] + 2*Close[pos2+1] + 2*Close[pos2+2] + Close[pos2+3]) / 6;
     pos2--;
  }
  if(pos>Bars-Length-3) pos = Bars-Length-3;
  while(pos>=0) {
//---- initial accumulation ???
     for(count=0;count<Length; count++){
        distance2[count]=0;
        for(lookback=1;lookback<Length;lookback++)
        {
           distance2[count] = distance2[count] + (smooth[pos+count] - smooth[pos+count + lookback])*(smooth[pos+count]- smooth[pos+count + lookback]);
        }
        coef[count] = distance2[count];
     }

     num = 0;
     sumcoef = 0;
     for(count=0;count<Length;count++)
     {
        num = num + coef[count]*smooth[pos+count];
        sumcoef = sumcoef + coef[count];
     }
     if (sumcoef != 0)  ExtMapBuffer[pos] = num / sumcoef;
     pos--;
  }
}
//+------------------------------------------------------------------+
/* Below is the EasyLanguage code:

Inputs:	Price((H+L)/2), Length(20);

Vars:	Smooth(0), count(0), LookBack(0), SumCoef(0), Num(0), Filt(0);

Array:	Coef[50](0), Distance2[50](0);

Smooth = (Price + 2*Price[1] + 2*Price[2] + Price[3]) / 6;
For count = 0 to Length -1 begin
   Distance2[count] = 0;
   For Lookback = 1 to Length-1 begin
      Distance2[count] = Distance2[count] + (Smooth[count] - Smooth[count + Lookback])*(Smooth[count]
	- Smooth[count + Lookback]);
   End;
   Coef[count] = Distance2[count];
End;
Num = 0;
SumCoef = 0;
For count = 0 to Length -1 begin
   Num = Num + Coef[count]*Smooth[count];
   SumCoef = Sumcoef + Coef[count];
End;
If SumCoef <> 0 then Filt = Num / SumCoef;

Plot1(Filt, "Ehlers");
*/
Comments