Dyn_Pivot
Download script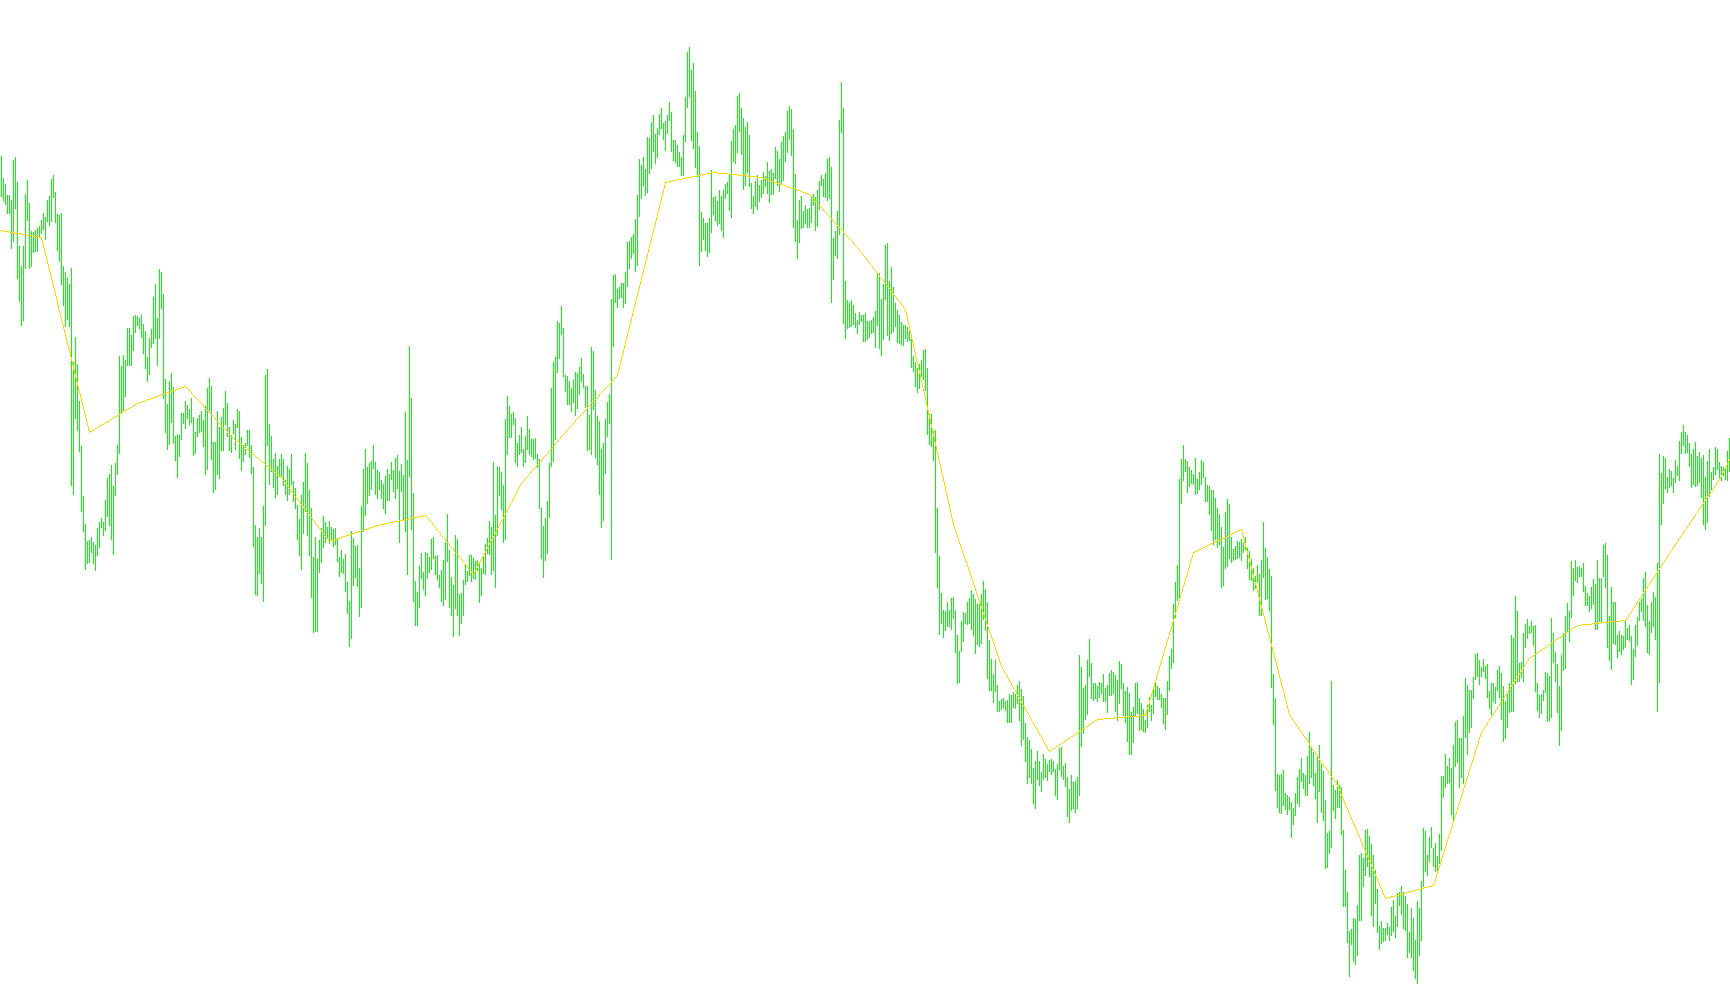
This technical tool is designed to automatically calculate and visualize "Pivot Points"—key price levels used by traders to identify potential support and resistance areas. Instead of requiring manual calculation, the script analyzes historical price action to determine these levels dynamically based on the previous day's performance.
Core Logic Overview
The script operates by scanning the market history to identify the specific boundaries of each trading day. It focuses on three primary pieces of data from the previous completed day:
- The High: The highest price reached during the previous session.
- The Low: The lowest price reached during the previous session.
- The Closing Price: The final price at which the previous day ended.
Calculation Methods
The tool offers two distinct mathematical formulas to determine the Pivot Point, depending on the user's preference:
- Standard Formula: This calculates a balanced average by combining the high, the low, and the closing price of the previous day.
- Alternative Formula: This places a heavier weight on the previous day's closing price, which can be useful for traders who believe the most recent closing price is a stronger indicator of where the market will move next.
Smart Visualization Features
To ensure the chart remains clean and readable, the script includes several "intelligent" behaviors:
- New Day Detection: The tool automatically recognizes when a new trading day begins and places the calculated Pivot Point at that specific moment.
- Dynamic Data Cleaning: To prevent the chart from becoming cluttered with unnecessary lines, the script is designed to clear old or irrelevant data points, focusing only on the most pertinent information for the current timeframe.
- Timeframe Optimization: The tool is specifically tuned for shorter timeframes (specifically those 4 hours and below), ensuring that the Pivot Points remain relevant and accurate to the speed of the market.
Summary for the User
In essence, this script automates a sophisticated calculation process. It looks at yesterday's "story"—how high it went, how low it dropped, and where it finished—and then projects a significant price level onto today's chart. This allows traders to quickly see where the market might encounter resistance or find support without having to perform any manual math.
//+------------------------------------------------------------------+
//|                                                   ^Dyn_Pivot.mq4 |
//|                                      Modest, Rosh conversed only |
//|                           http://forexsystems.ru/phpBB/index.php |
//+------------------------------------------------------------------+
#property copyright "Modest, Rosh conversed only"
#property link      "http://forexsystems.ru/phpBB/index.php"

#property indicator_chart_window
#property indicator_buffers 1
#property indicator_color1 DarkGreen
//---- input parameters
extern int       Formula=0;
int i=1, shift;
double FP=0.0;
double FH=0.0, FL=0.0;
bool result;
//---- buffers
double ExtMapBuffer1[];

//+------------------------------------------------------------------+
//| Ïðîâåðêà íîâîãî äíÿ                                              |
//+------------------------------------------------------------------+
bool isNewDay(int _shift)
  {
//----
   result=false;
   if (  (TimeHour(Time[_shift])==0)  && (TimeMinute(Time[_shift])==0)   ) result=true;

//----
   return(result);
  }
//+------------------------------------------------------------------+
//| Ïîëó÷èòü óðîâåíü FP ïðîøåäøåãî äíÿ                               |
//+------------------------------------------------------------------+
double GetFPofDay(int _shift)
  {
  int prevDay=TimeDay(Time[_shift+1]);
//----
   i=1;
   while (TimeDay(Time[_shift+i])==prevDay) i++;
   i--;
   FH=High[Highest(NULL,0,MODE_HIGH,i,_shift+1)];
   FL=Low[Lowest(NULL,0,MODE_LOW,i,_shift+1)];
   if (Formula==0) FP=NormalizeDouble((FH+FL+Close[_shift+1])/3.0,Digits); else FP=NormalizeDouble((FH+FL+2*Close[_shift+1])/4.0,Digits);
//----
   return(FP);
  }
//+------------------------------------------------------------------+
//| Ðàáîòà â íóëåâîì áàðå                                            |
//+------------------------------------------------------------------+
void SetNullBarValue(int _shift)
  {
  int cnt;
  int currDay=TimeDay(Time[_shift]);
//----
   i=1;
   while (TimeDay(Time[_shift+i])==currDay) i++;
   if (i>=2)
      {
      i=i-2;
      for (cnt=i;cnt>0;cnt--) ExtMapBuffer1[shift+cnt]=0.0;
      FH=High[Highest(NULL,0,MODE_HIGH,i+1,_shift)];
      FL=Low[Lowest(NULL,0,MODE_LOW,i+1,_shift)];
      if (Formula==0) FP=NormalizeDouble((FH+FL+Close[_shift+1])/3.0,Digits); else FP=NormalizeDouble((FH+FL+2*Close[_shift+1])/4.0,Digits);
      ExtMapBuffer1[_shift]=FP;
      }
//----
   return;
  }
//+------------------------------------------------------------------+
//| Custom indicator initialization function                         |
//+------------------------------------------------------------------+
int init()
  {
   if (Formula!=0)Formula=1;
   string label="FP("+Formula+")";
//---- indicators
   SetIndexStyle(0,DRAW_SECTION);
   SetIndexBuffer(0,ExtMapBuffer1);
   SetIndexEmptyValue(0,0.0);
   SetIndexLabel(0,label);

//----
   return(0);
  }
//+------------------------------------------------------------------+
//| Custor indicator deinitialization function                       |
//+------------------------------------------------------------------+
int deinit()
  {
//----

//----
   return(0);
  }
//+------------------------------------------------------------------+
//| Custom indicator iteration function                              |
//+------------------------------------------------------------------+
int start()
  {
   int limit,firstDay;
   int counted_bars=IndicatorCounted();
   if (counted_bars<0) return(0);
   if (counted_bars==0)
      {
      limit=Bars-1;
      i=1;
      firstDay=TimeDay(Time[limit]);
      while (TimeDay(Time[limit-i])==firstDay) i++;
      limit=limit-i-PERIOD_D1/Period();
      }
   if (counted_bars>0) limit=Bars-counted_bars;
//----
   if (Period()>PERIOD_H4) return;
   for (shift=limit;shift>=0;shift--)
      {
      if (isNewDay(shift)) ExtMapBuffer1[shift]=GetFPofDay(shift); else  ExtMapBuffer1[shift]=0.0;
      if (shift==0) SetNullBarValue(shift);
      }
//----
   return(0);
  }
//+------------------------------------------------------------------+
Comments