ECO_v1
Download script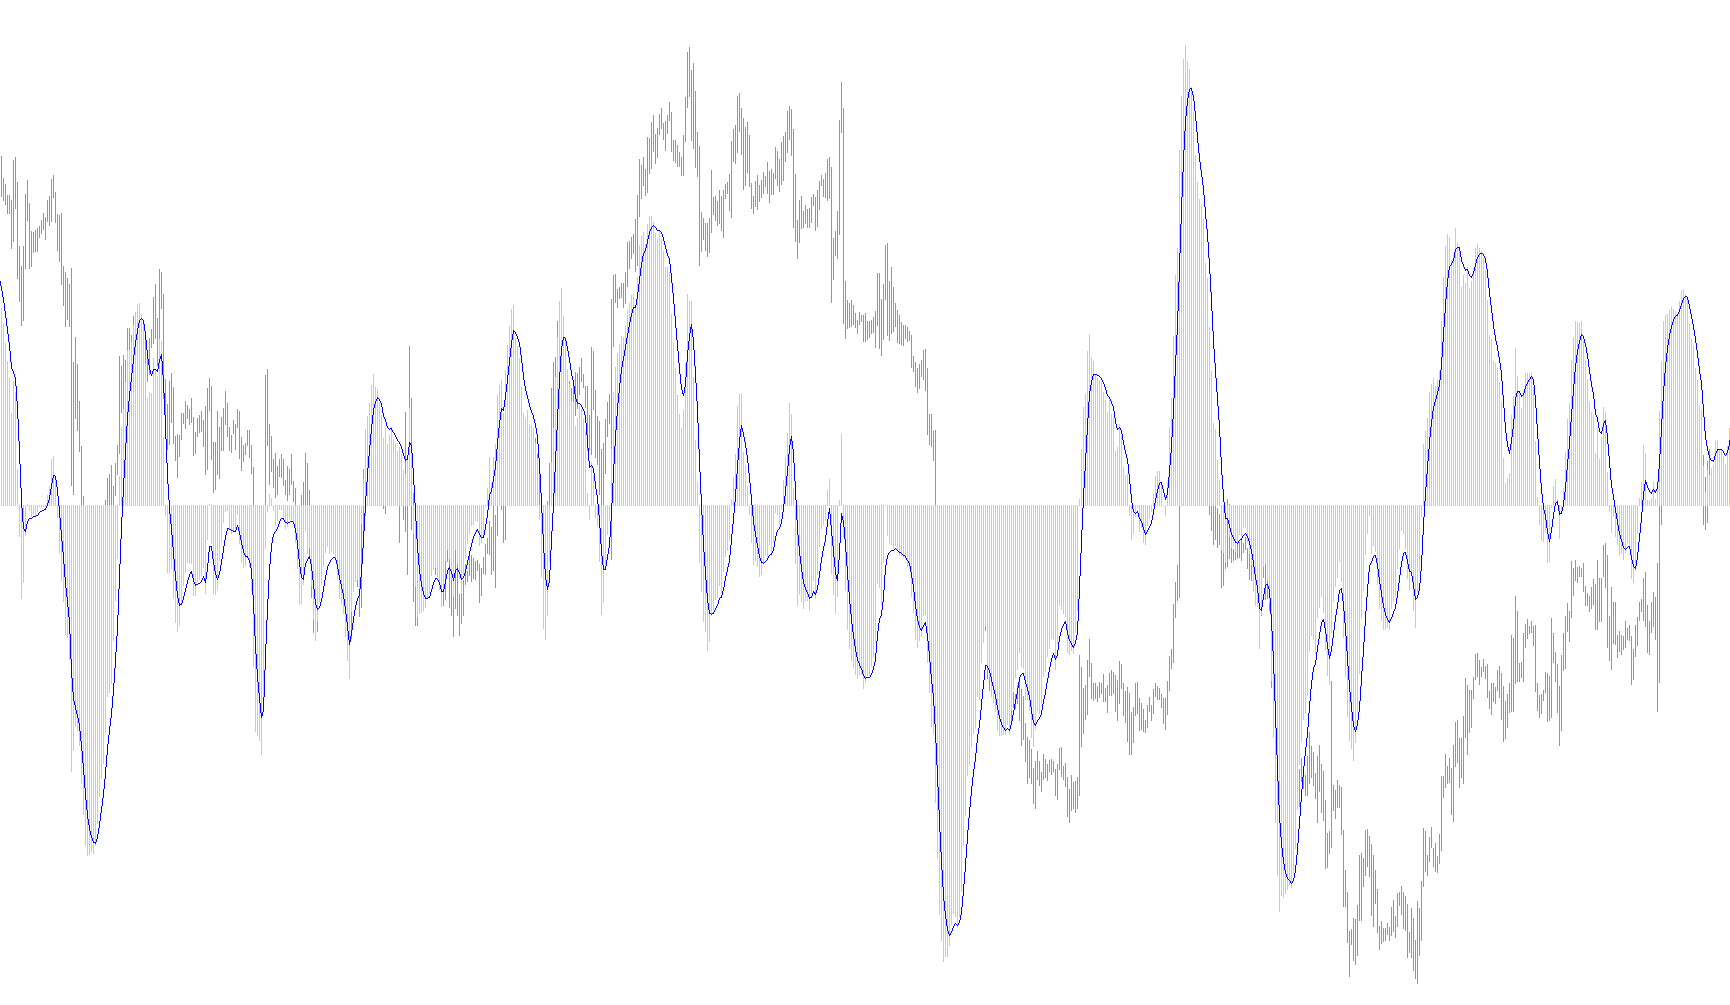
The Ergodic Candlestick Oscillator (ECO) is a specialized financial analysis tool designed to measure and visualize market momentum by comparing the "body" of price candles to their total "range." Instead of simply looking at where the price ends up, this script analyzes the relationship between how much price actually moved relative to its total volatility.
Core Logic and Methodology
The indicator operates through a multi-layered smoothing process to filter out market noise and identify significant trends. Its logic can be broken down into three main stages:
1. Data Extraction (Body vs. Range) The script begins by calculating two primary raw values for every price candle:
- The Body: The difference between the opening and closing prices. This represents the actual "distance" traveled by the market during a specific period.
- The Range: The difference between the highest and lowest prices. This represents the total volatility or "space" occupied by the market during that same period.
2. Double Smoothing (Nested Moving Averages) To prevent the data from being too erratic or reacting to every minor fluctuation, the script applies a two-stage smoothing technique:
- It first calculates a short-term moving average of both the Body and the Range.
- It then takes those results and calculates a second, longer-term moving average. By nesting these averages, the tool prioritizes sustained trends over temporary spikes, providing a much cleaner visual representation of market behavior.
3. The Percentage Calculation (The ECO Value) The final value is produced by dividing the smoothed "Body" data by the smoothed "Range" data and multiplying it by 100.
- This creates a percentage-based oscillator that shows how much of the available price range is being consumed by the candle bodies.
- A high positive value indicates strong, decisive movement (where the bodies are large compared to the wicks).
- A low or negative value suggests indecision or exhaustion (where the candles have small bodies but long wicks, indicating a struggle between buyers and sellers).
Visual Indicators
The script provides two distinct components for the user:
- The Histogram (K%): This is the primary oscillator. It shows the calculated ECO percentage, allowing users to see the strength of the current trend relative to historical volatility.
- The Signal Line (D%): The script calculates a final moving average of the ECO value itself. This acts as a secondary "signal" line, helping traders identify when the momentum is beginning to shift or slow down.
By using this logic, the indicator seeks to quantify market "conviction," helping users distinguish between aggressive trend movements and volatile, non-directional price action.
/*
William Blau Ergodic.

ECO - Ergodic Candlestick Oscillator
(MOV(MOV(C-O,5,E))26,E)/MOV(MOV(H-L,5,E))26,E))*100

Linuxser 2007

*/

#property copyright "Under The GNU General Public License"
#property link      "www.gnu.org"

#property indicator_separate_window
#property indicator_buffers 2
#property indicator_color1 MediumOrchid
#property indicator_color2 Black
#property indicator_width1 2
#property indicator_width2 0
#property indicator_maximum 40
#property indicator_minimum -40
#property indicator_level1 20
#property indicator_level2 -20
#property indicator_levelcolor Red
#property indicator_levelstyle 2


//---- input parameters
//extern int       Price= 0;   // Apply to Price(0-Close;1-Open;2-High;3-Low;4-Median price;5-Typical price;6-Weighted Close)
extern int       First_R=26;
extern int       Second_S=5;
extern int       Signal=5;
extern int       MA_Mode=1; //MODE_SMA :	0 // MODE_EMA:	1 // MODE_SMMA: 2 // MODE_LWMA: 3 //

//---- buffers
double ECO_Buffer[];
double D_Buffer[];
double HiLo_Buffer[];
double OpenClose_Buffer[];
double EMA_HiLo_Buffer[];
double EMA2_HiLo_Buffer[];
double EMA_OpenClose_Buffer[];
double EMA2_OpenClose_Buffer[];
//+------------------------------------------------------------------+
//| Custom indicator initialization function                         |
//+------------------------------------------------------------------+
int init()
  {
//---- indicators
   IndicatorBuffers(8);
   SetIndexBuffer(2, HiLo_Buffer);
   SetIndexBuffer(3, EMA_HiLo_Buffer);
   SetIndexBuffer(4, EMA2_HiLo_Buffer);
   SetIndexBuffer(5, OpenClose_Buffer);
   SetIndexBuffer(6, EMA_OpenClose_Buffer);
   SetIndexBuffer(7, EMA2_OpenClose_Buffer);

   SetIndexStyle(0,DRAW_HISTOGRAM);
   SetIndexBuffer(0,ECO_Buffer);
   SetIndexLabel(0,"K_%");
   SetIndexStyle(1,DRAW_LINE);
   SetIndexArrow(1,108);
   SetIndexBuffer(1,D_Buffer);
   SetIndexLabel(1,"D_%");
   IndicatorShortName("ECO v1"+"("+First_R+","+Second_S+",["+Signal+"])");

//----
   return(0);
  }
//+------------------------------------------------------------------+
//| Custor indicator deinitialization function                       |
//+------------------------------------------------------------------+
int deinit()
  {
//---- TODO: add your code here

//----
   return(0);
  }
//+------------------------------------------------------------------+
//| Custom indicator iteration function                              |
//+------------------------------------------------------------------+
int start()
  {
   int    counted_bars=IndicatorCounted();
   int limit,i;
   limit=Bars-counted_bars-1;
   for (i=Bars-1;i>=0;i--)
      {
      HiLo_Buffer[i]= High[i]-Low[i];
      OpenClose_Buffer[i]=Close[i]-Open[i];
      }

   for (i=Bars-1;i>=0;i--)
      {
      EMA_HiLo_Buffer[i]=iMAOnArray(HiLo_Buffer,Bars,Second_S,0,MA_Mode,i);
      EMA_OpenClose_Buffer[i]=iMAOnArray(OpenClose_Buffer,Bars,Second_S,0,MA_Mode,i);
      }

   for (i=Bars-1;i>=0;i--)
      {
      EMA2_HiLo_Buffer[i]=iMAOnArray(EMA_HiLo_Buffer,Bars,First_R,0,MA_Mode,i);
      EMA2_OpenClose_Buffer[i]=iMAOnArray(EMA_OpenClose_Buffer,Bars,First_R,0,MA_Mode,i);
      }

   for (i=limit;i>=0;i--)
      {
      if(iMAOnArray(EMA_OpenClose_Buffer,Bars,First_R,0,MA_Mode,i) != 0)
      ECO_Buffer[i]=100.0*(EMA2_OpenClose_Buffer[i]/EMA2_HiLo_Buffer[i]);
      }
   for (i=limit;i>=0;i--)
      {
      D_Buffer[i]=iMAOnArray(ECO_Buffer,Bars,Signal,0,MA_Mode,i);
      }


//----
   return(0);
  }
//+------------------------------------------------------------------+
Comments