Ehlers Fisher transform histo
Download script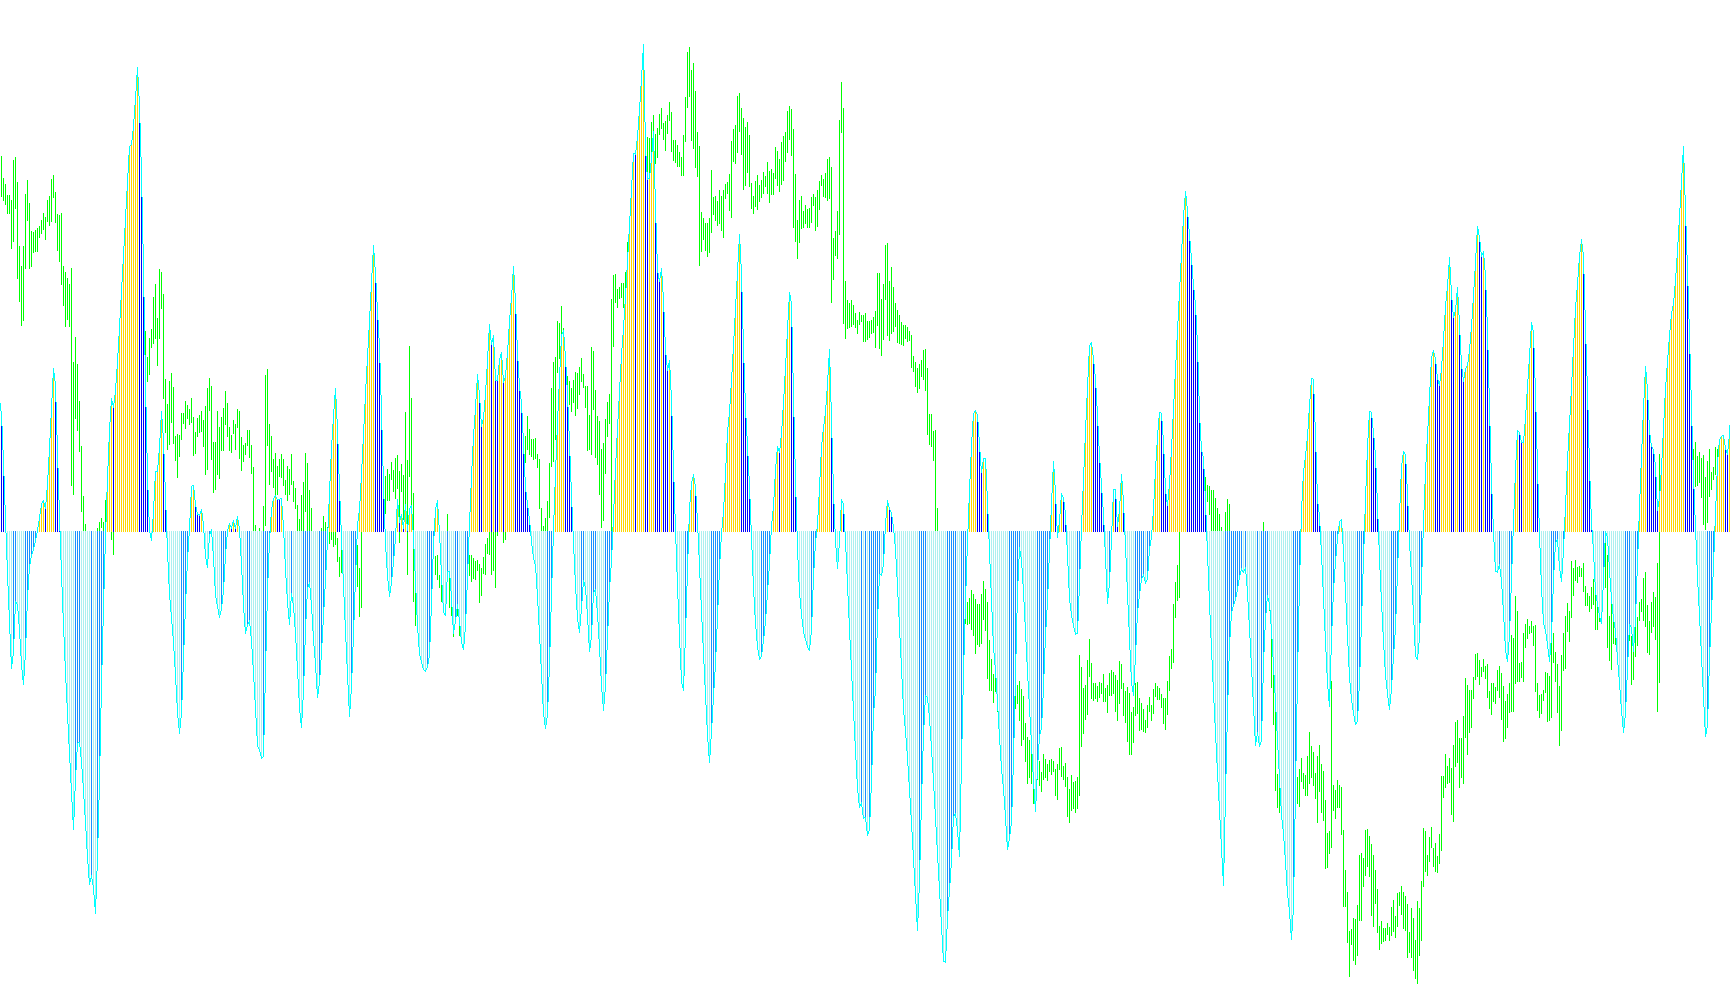
This technical indicator is designed to identify and visualize momentum shifts in the financial markets by utilizing a specialized mathematical process known as the Fisher Transform. Unlike standard moving averages that simply track price direction, this tool focuses on normalizing price fluctuations into a bounded range, making it easier for traders to spot significant turning points.
Core Methodology
The logic operates through a multi-layered calculation process:
1. Price Normalization The script begins by calculating a median price point over a user-defined period. It then identifies the highest and lowest prices within that same timeframe. By comparing the current price against these extremes, the indicator determines where the price sits relative to its recent range.
2. Momentum Smoothing Instead of reacting instantly to every price tick—which can often lead to "market noise"—the script applies a weighted smoothing technique. It blends the current relative position of the price with the previous calculation's data. This creates a more fluid movement, helping to filter out minor fluctuations while preserving the integrity of the primary trend.
3. The Fisher Transform & Logarithmic Scaling The core "engine" of this script involves a logarithmic transformation. By converting the smoothed values into a specific mathematical curve, the indicator expands the visual representation of price trends. This makes subtle movements more apparent and helps identify when a trend is reaching an extreme state or beginning to reverse.
Visual Logic and Signals
The indicator translates these complex calculations into a clear visual histogram on your chart:
- Trend Tracking: The script monitors whether the transformed value is increasing or decreasing relative to the previous data point.
- Dynamic Coloring: To assist with quick decision-making, the indicator changes color based on both the position of the value (above or below the zero line) and the direction of the movement.
- Green Bars generally represent upward momentum or bullish sentiment.
- Red Bars typically indicate downward momentum or bearish sentiment.
- Stability Check: The logic includes a safeguard that ensures visual continuity; if the value remains unchanged between periods, the indicator maintains its previous state to prevent flickering on the chart.
Summary for the User
Essentially, this script acts as a "magnifying glass" for market momentum. It takes raw price data, smooths out the unnecessary noise, and transforms it into a normalized scale. This allows you to see where the current trend is gaining strength and, more importantly, helps identify the specific moments when that strength begins to fade.
//+----------------------------------------------------------+
//|                                 Ehlers' fisher transform |
//|                                                   mladen |
//+----------------------------------------------------------+
#property  copyright "mladen"
#property  link      "mladenfx@gmail.com"

#property  indicator_separate_window
#property  indicator_buffers 5
#property  indicator_color1  Green
#property  indicator_color2  Green
#property  indicator_color3  Red
#property  indicator_color4  Red
#property  indicator_color5  DimGray
#property  indicator_width1  2
#property  indicator_width3  2
#property  indicator_width5  2

//
//
//
//
//

extern int  period    = 10;
extern int  PriceType = PRICE_MEDIAN;

//
//
//
//
//

double buffer1[];
double buffer2[];
double buffer3[];
double buffer4[];
double buffer5[];
double Prices[];
double Values[];


//+----------------------------------------------------------+
//|                                                          |
//+----------------------------------------------------------+
//
//
//
//
//

int init()
{
   IndicatorBuffers(7);
      SetIndexBuffer(0,buffer1); SetIndexStyle(0,DRAW_HISTOGRAM);
      SetIndexBuffer(1,buffer2); SetIndexStyle(1,DRAW_HISTOGRAM);
      SetIndexBuffer(2,buffer3); SetIndexStyle(2,DRAW_HISTOGRAM);
      SetIndexBuffer(3,buffer4); SetIndexStyle(3,DRAW_HISTOGRAM);
      SetIndexBuffer(4,buffer5);
      SetIndexBuffer(5,Prices);
      SetIndexBuffer(6,Values);
   IndicatorShortName("Ehlers\' Fisher transform ("+period+")");
   return(0);
}


//+----------------------------------------------------------+
//|                                                          |
//+----------------------------------------------------------+
//
//
//
//
//

int start()
{
   int  counted_bars=IndicatorCounted();
   int  i,limit;

   if(counted_bars < 0) return(-1);
   if(counted_bars > 0) counted_bars--;
           limit = Bars-counted_bars;

   //
   //
   //
   //
   //

   for(i=limit; i>=0; i--)
   {
      Prices[i] = iMA(NULL,0,1,0,MODE_SMA,PriceType,i);

      //
      //
      //
      //
      //

         double MaxH = Prices[ArrayMaximum(Prices,period,i)];
         double MinL = Prices[ArrayMinimum(Prices,period,i)];
         if (MaxH!=MinL)
               Values[i] = 0.33*2*((Prices[i]-MinL)/(MaxH-MinL)-0.5)+0.67*Values[i+1];
         else  Values[i] = 0.00;
               Values[i] = MathMin(MathMax(Values[i],-0.999),0.999);
               buffer5[i] = 0.5*MathLog((1+Values[i])/(1-Values[i]))+0.5*buffer5[i+1];

      //
      //
      //
      //
      //

         if(buffer5[i]==buffer5[i+1])
            {
               buffer1[i]=buffer1[i+1];
               buffer2[i]=buffer2[i+1];
               buffer3[i]=buffer3[i+1];
               buffer4[i]=buffer4[i+1];
               continue;
            }

         //
         //
         //
         //
         //

            buffer1[i]=EMPTY_VALUE;
            buffer2[i]=EMPTY_VALUE;
            buffer3[i]=EMPTY_VALUE;
            buffer4[i]=EMPTY_VALUE;
            if(buffer5[i]<0)
               {
                  if (buffer5[i]<buffer5[i+1]) buffer3[i]=buffer5[i];
                  if (buffer5[i]>buffer5[i+1]) buffer4[i]=buffer5[i];
               }
            if(buffer5[i]>0)
               {
                  if (buffer5[i]<buffer5[i+1]) buffer2[i]=buffer5[i];
                  if (buffer5[i]>buffer5[i+1]) buffer1[i]=buffer5[i];
               }
   }
   return(0);
}
Comments