EES V Speed v1.1
Download script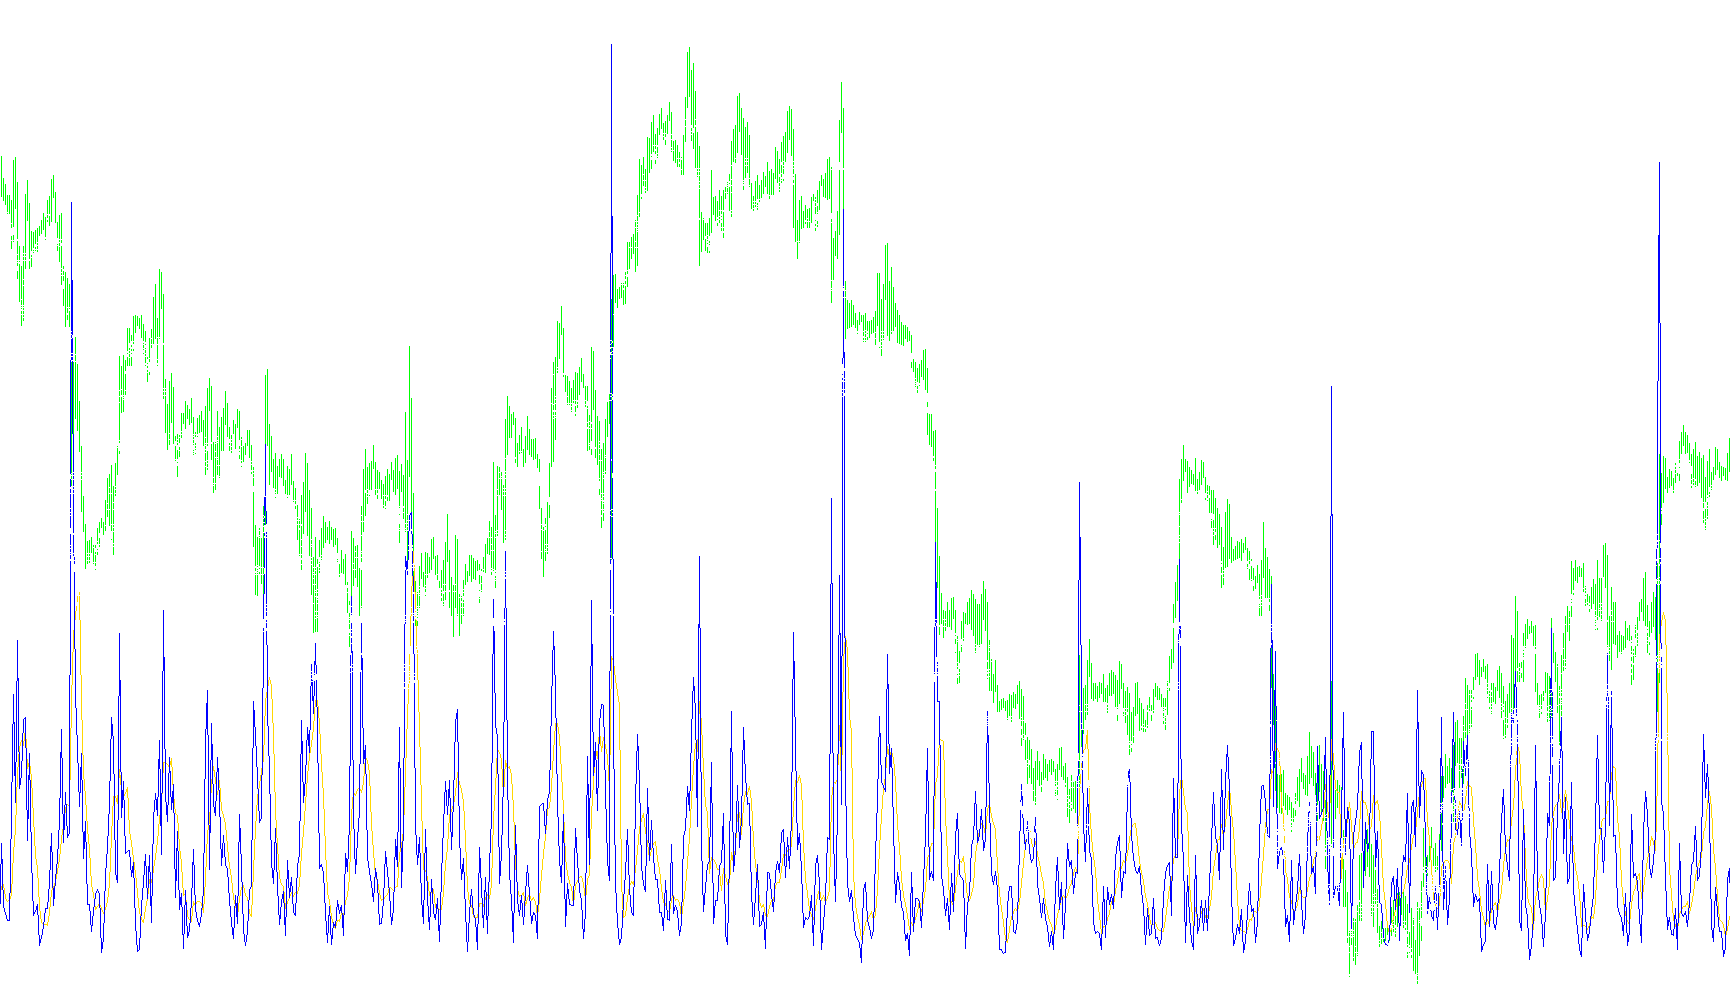
The EES V Speed indicator is designed to help traders visualize market volatility and the "velocity" of price movements. Instead of looking at simple price action, this tool measures how much distance the price covers within a specific timeframe, smoothing that data out to highlight trends more clearly.
How the Logic Works
The indicator operates through a three-step calculation process to turn raw market noise into readable data:
1. Measuring Volatility (The Raw Range) The script first looks at every individual candle on the chart. It calculates the distance between the highest point (High) and the lowest point (Low) of that candle. This represents the total "movement" or volatility for that specific period. By dividing this range by the minimum price movement (points), it creates a standardized value of how "fast" or wide the price action was at that moment.
2. Smoothing the Speed (V_Speed) Because raw volatility can be very jumpy, the script applies a Moving Average to those high/low ranges. This produces the V Speed line. This line represents a smoothed average of market activity over a user-defined period. When this value is high, it indicates significant price movement; when low, it suggests a quieter, consolidating market.
3. Identifying Trends (The Moving Average) To make the data even more actionable, the script applies a second moving average to the V Speed line itself. This creates a "trend of the trend." By comparing the primary V Speed line against this secondary average, traders can better identify whether the intensity of market volatility is accelerating or decelerating.
Visual Features
- Data Labels: The script can automatically place text labels directly on the chart bars. These labels show the specific calculated "Speed" value, allowing you to see the exact intensity of a price move at a glance.
- Reference Line: There is an option to display a horizontal reference line. This helps visualize the current speed level relative to recent history, providing a quick visual cue of whether current market activity is above or below a certain threshold.
Summary for the User
In simple terms, this indicator tells you how hard the market is moving. It takes the "stretch" of each candle, averages it out to remove noise, and then applies a secondary trend line so you can see if market momentum is gaining strength or fading away.
//+------------------------------------------------------------------+
//|                                                  EES V Speed.mq4 |
//|                         Copyright © 2009, Elite E Services, Inc. |
//|                                    http://www.eliteeservices.net |
//+------------------------------------------------------------------+
#property copyright "Copyright © 2009, Elite E Services, Inc."
#property link      "http://www.eliteeservices.net"

#property indicator_separate_window
#property indicator_buffers 2
#property indicator_color1 DodgerBlue
#property indicator_color2 Red
#property indicator_style2 STYLE_DOT


extern int
   V_Period       = 5,
   MA_Period      = 13;
extern bool
   Draw_Value_Line = true,
   Display_V_On_Bar  = true;
extern double
   TextColor1 = Black;
/*
extern bool
   Export_Values_To_File = true;
extern string
   Export_FileName       = "V_Speed";
*/
double VBuff[];
double MABuff[];
double TempBuffer[];
int MyDigits;
double MyPoint;
   string short_name;
int BARS;
//+------------------------------------------------------------------+
//| expert initialization function                                   |
//+------------------------------------------------------------------+
int init()
  {
//----
  if(Digits==5)MyDigits=4;
  else if(Digits==3)MyDigits=2;
  else MyDigits = Digits;
  if (Point == 0.00001) MyPoint = 0.0001; //6 digits
  else if (Point == 0.001) MyPoint = 0.01; //3 digits (for Yen based pairs)
  else MyPoint = Point; //Normal
//---- indicators

//---- 1 additional buffer used for counting.
   IndicatorBuffers(3);
//---- indicator line
   SetIndexStyle(0,DRAW_LINE);
   SetIndexBuffer(0,VBuff);
   SetIndexStyle(1,DRAW_LINE);
   SetIndexBuffer(1,MABuff);
   SetIndexBuffer(1,TempBuffer);
//---- name for DataWindow and indicator subwindow label
   short_name="EES V Speed("+V_Period+")";
   IndicatorShortName(short_name);
   SetIndexLabel(0,short_name);
//----
   SetIndexDrawBegin(0,V_Period);
//----
   return(0);
  }
//+------------------------------------------------------------------+
//| Custom indicator deinitialization function                       |
//+------------------------------------------------------------------+
int deinit()
  {
//----
   ObjectsDeleteAll( 0, OBJ_TEXT);
//----
   return(0);
  }
//+------------------------------------------------------------------+
//| Custom indicator iteration function                              |
//+------------------------------------------------------------------+
int start()
  {
   int i,counted_bars=IndicatorCounted();
//----
   if(Bars<=V_Period) return(0);
//---- initial zero
   if(counted_bars<1)
      for(i=1;i<=V_Period;i++) VBuff[Bars-i]=0.0;
//----
   i=Bars-counted_bars-1;

   BARS = Bars;
   while(i>=0)
   {
      double high=High[i];
      double low =Low[i];
      if(i==Bars-1) TempBuffer[i]=(high-low)/MyPoint;
      else
        {
         double prevclose=Close[i+1];
         TempBuffer[i]=(high-low)/MyPoint;
        }
      i--;
   }
//----
   if(counted_bars>0) counted_bars--;
   int limit=Bars-counted_bars;
   for(i=0; i<limit; i++)
   {
      VBuff[i]=iMAOnArray(TempBuffer,Bars,V_Period,0,MODE_SMA,i);
      if(Display_V_On_Bar)
      {
         if(ObjectFind("VBar"+iTime(Symbol(),0,i))<0)
         {
            ObjectCreate("VBar"+iTime(Symbol(),0,i),OBJ_TEXT, 0, iTime(Symbol(),0,i), Low[i]-VBuff[i]/2*MyPoint);
            ObjectSetText("VBar"+iTime(Symbol(),0,i), DoubleToStr(VBuff[i],1), 8, "Tahoma", TextColor1);
         }
         if(ObjectFind("VBar"+iTime(Symbol(),0,i))>-1)
         {
            ObjectSetText("VBar"+iTime(Symbol(),0,i), DoubleToStr(VBuff[i],1), 8, "Tahoma", TextColor1);
         }
      }

   }
   for(i=0; i<limit; i++)
      MABuff[i]=iMAOnArray(VBuff,Bars,MA_Period,0,MODE_SMA,i);
//----

   if(Draw_Value_Line)
   {
      double C = VBuff[0];
      int win = WindowFind(short_name);
      if(ObjectFind("CRBC Indicator Price Line"+win)<=-1)
      {
         ObjectCreate("CRBC Indicator Price Line"+win,OBJ_HLINE,WindowFind(short_name),iTime(Symbol(),0,2),C,iTime(Symbol(),0,0),C);
      }
      if(ObjectFind("CRBC Indicator Price Line"+win)>-1) ObjectMove("CRBC Indicator Price Line"+win, 0, iTime(Symbol(),0,2), C);
      ObjectSet("CRBC Indicator Price Line"+win, OBJPROP_COLOR, LightSlateGray);
   }

/*
   i=Bars-counted_bars-1;
   while(i>=0)
   {
      subFileWriteValuesCSV(Symbol()+" "+Export_FileName, TimeToStr(iTime(Symbol(),0,i),TIME_DATE|TIME_MINUTES), DoubleToStr(VBuff[i],MyDigits), DoubleToStr(MABuff[i],MyDigits));
      i--;
   }
*/
   return(0);
  }
//+------------------------------------------------------------------+
/*
void subFileWriteValuesCSV(string filename, string value1, string value2,string value3)
{
  int handle =0;
  datetime orderOpen=TimeCurrent();
  string fn = filename+".csv";
  handle=FileOpen(fn, FILE_CSV|FILE_READ|FILE_WRITE, ',');

  if(handle<1)
  {
     FileWrite(handle, "CURRENT TIME", "V SPEED VALUE", "MA VALUE");
     FileClose(handle);
  }

  if(handle>0)
  {
     FileSeek(handle, 0, SEEK_END);
     FileWrite(handle, value1, value2,value3);
     FileClose(handle);
  }
}
*/
Comments