ECO
Download script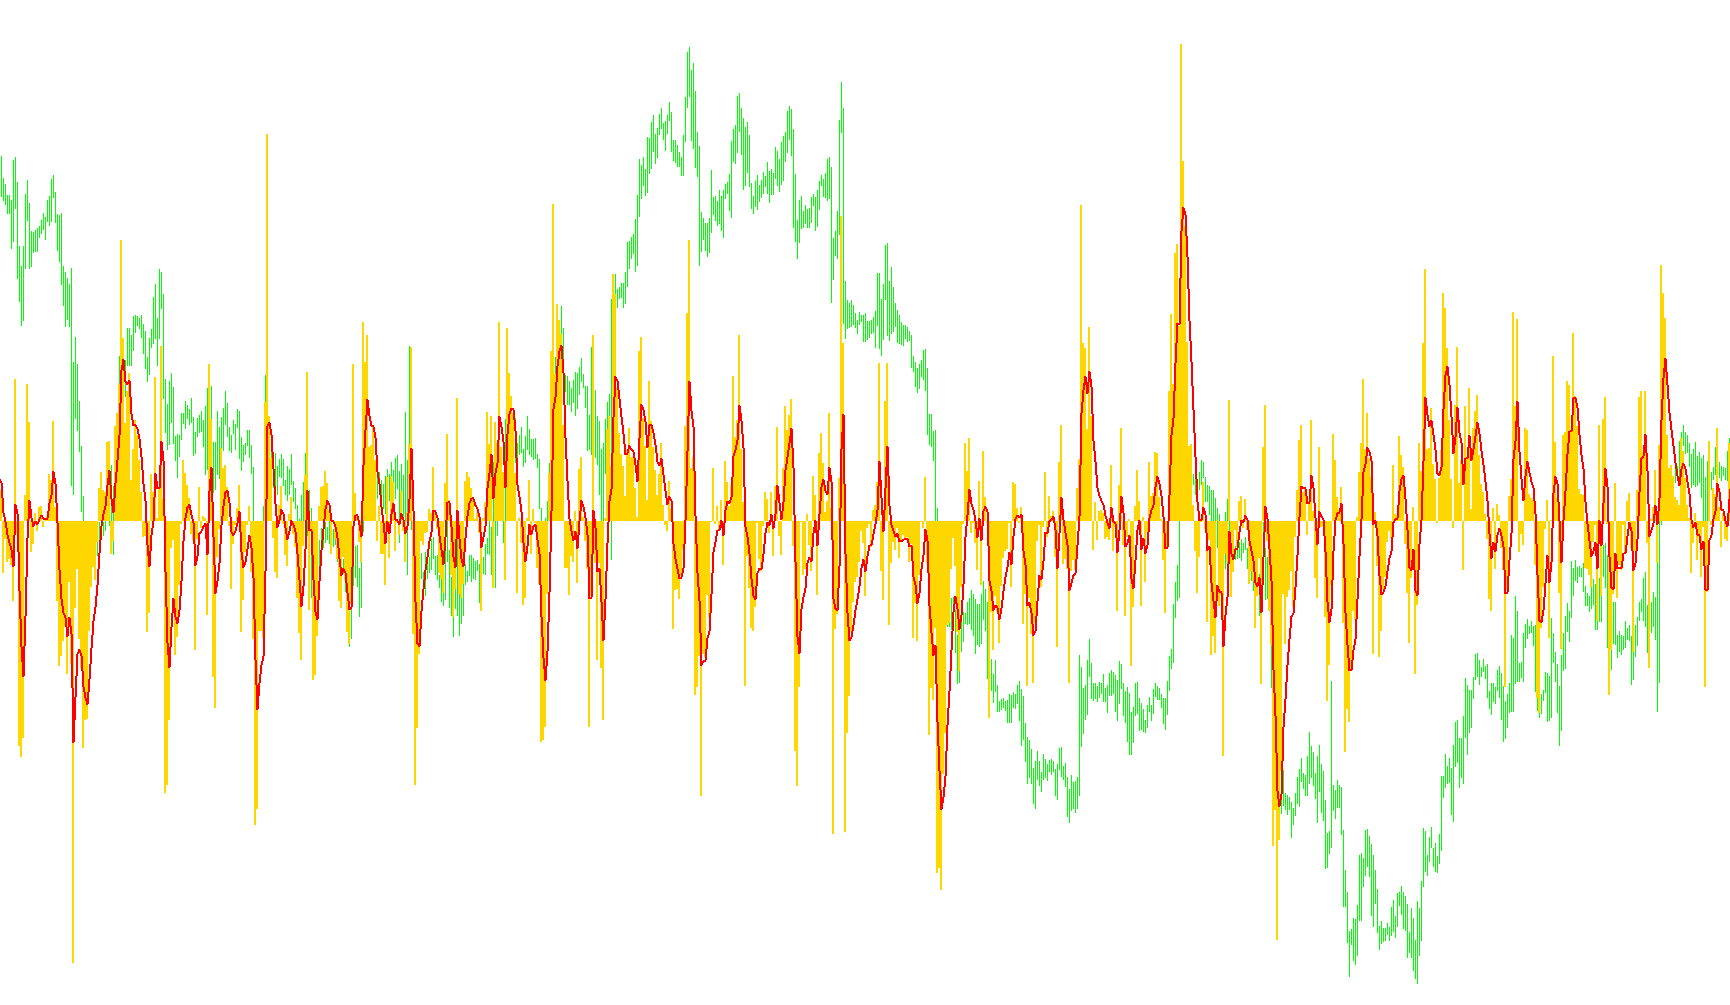
This tool is designed as a visual trading indicator that measures the relationship between price movement and market volatility. Instead of looking at simple price points, it analyzes how much of the total "price range" during a specific period is accounted for by the actual closing action of the candles.
Core Logic and Mechanics
The indicator operates through a multi-step processing sequence:
1. Data Foundation (Price Ranges) The script begins by calculating two fundamental values for every price candle:
- High-Low Range: The total distance between the highest and lowest price reached. This represents the overall volatility of that period.
- Open-Close Range: The specific distance traveled from the opening price to the closing price. This represents the "actual progress" made by the market direction.
2. Smoothing and Weighting To filter out "market noise" (random, jagged price flickers), the script applies two layers of mathematical smoothing known as Exponential Moving Averages (EMA).
- It takes the volatility data and the movement data and smooths them out based on user-defined parameters.
- This ensures that the resulting visual lines are fluid and represent broader trends rather than every tiny, insignificant price twitch.
3. The ECO Calculation The primary output—the "ECO" value—is calculated by taking the smoothed movement data and dividing it by the smoothed volatility data, then converting it to a percentage scale (0–100).
- Essentially, this tells you: "What percentage of the available price action in this period was actually captured by the closing price?"
4. The Signal Layer Finally, the script takes that ECO percentage and applies one last smoothing pass to create a "Signal" line. This serves as a secondary reference point to help identify when the underlying momentum is shifting or stabilizing.
Visual Interpretation
The resulting indicator appears in a separate window below your price chart:
- The Histogram (ECO): Represents the primary momentum strength based on the percentage of price progress relative to volatility.
- The Signal Line: Acts as a guide to help users see the direction of the ECO trend.
By focusing on the ratio between "total movement" and "actual progress," the logic aims to provide a clearer picture of market strength, helping traders distinguish between high-volatility exhaustion and steady, purposeful price trends.
//+------------------------------------------------------------------+
//|                                                          ECO.mq4 |
//|                      Copyright © 2005, MetaQuotes Software Corp. |
//|                                        http://www.metaquotes.net |
//+------------------------------------------------------------------+
#property copyright "Rosh"
#property link      "http://www.metaquotes.net"

#property indicator_separate_window
#property indicator_buffers 2
#property indicator_color1 White
#property indicator_color2 Red
//---- input parameters
extern int       First_R=26;
extern int       Second_S=5;
extern int       Signal=5;
extern bool EMA_Type=true;
double R_ALFA;
double S_ALFA;
//---- buffers
double ECO_Buffer[];
double Signal_Buffer[];
double HiLo_Buffer[];
double OpenClose_Buffer[];
double EMA_HiLo_Buffer[];
double EMA_OpCl_Buffer[];
double EMA2_HiLo_Buffer[];
double EMA2_OpCl_Buffer[];
//+------------------------------------------------------------------+
//| Custom indicator initialization function                         |
//+------------------------------------------------------------------+
int init()
  {
   string short_name;
//---- 6 additional buffers are used for counting.
   IndicatorBuffers(8);
   SetIndexStyle(0,DRAW_HISTOGRAM,STYLE_SOLID,2);
   SetIndexBuffer(0,ECO_Buffer);
   if (EMA_Type) SetIndexStyle(1,DRAW_LINE,STYLE_SOLID,2,Red); else SetIndexStyle(1,DRAW_LINE,STYLE_SOLID,2,Black);
   SetIndexBuffer(1,Signal_Buffer);
   SetIndexLabel(0,"ECO");
   SetIndexLabel(1,"Signal");
   short_name="ECO("+First_R+","+Second_S+","+Signal+")";
   IndicatorShortName(short_name);

   SetIndexBuffer(2, HiLo_Buffer);
   SetIndexBuffer(3, OpenClose_Buffer);
   SetIndexBuffer(4, EMA_HiLo_Buffer);
   SetIndexBuffer(5, EMA_OpCl_Buffer);
   SetIndexBuffer(6, EMA2_HiLo_Buffer);
   SetIndexBuffer(7, EMA2_OpCl_Buffer);

   R_ALFA=2.0/(First_R+1);
   S_ALFA=2.0/(Second_S+1);
   if (EMA_Type)
      {
      R_ALFA=1.0-R_ALFA;
      S_ALFA=1.0-S_ALFA;
      }
//----
   return(0);
  }
//+------------------------------------------------------------------+
//| Custor indicator deinitialization function                       |
//+------------------------------------------------------------------+
int deinit()
  {
//---- TODO: add your code here

//----
   return(0);
  }
//+------------------------------------------------------------------+
//| Custom indicator iteration function                              |
//+------------------------------------------------------------------+
int start()
  {
   int    counted_bars=IndicatorCounted();
   int i,limit;
   if (counted_bars<0) return(-1);
   //if (counted_bars==0) counted_bars--;
   limit=Bars-counted_bars-1;
   //Comment("counted_bars=",counted_bars);
   for (i=limit;i>=0;i--)
      {
      HiLo_Buffer[i]=High[i]-Low[i];
      OpenClose_Buffer[i]=Close[i]-Open[i];
      //ECO_Buffer[i]=High[i]-Low[i];
      //Signal_Buffer[i]=Close[i]-Open[i];
      //Print("HiLo_Buffer["+i+"]=",HiLo_Buffer[i]);
      //Print("OpenClose_Buffer["+i+"]=",OpenClose_Buffer[i]);
      }
   if (counted_bars==0)
      {
      EMA_HiLo_Buffer[limit]=HiLo_Buffer[limit];
      EMA_OpCl_Buffer[limit]=OpenClose_Buffer[limit];
      }
   for (i=limit-1;i>=0;i--)
      {
      EMA_HiLo_Buffer[i]=(1-R_ALFA)*HiLo_Buffer[i]+R_ALFA*EMA_HiLo_Buffer[i+1];
      EMA_OpCl_Buffer[i]=(1-R_ALFA)*OpenClose_Buffer[i]+R_ALFA*OpenClose_Buffer[i+1];
      }
   if (counted_bars==0)
      {
      EMA2_HiLo_Buffer[limit-1]=EMA_HiLo_Buffer[limit-1];
      EMA2_OpCl_Buffer[limit-1]=EMA_OpCl_Buffer[limit-1];
      }
   for (i=limit-2;i>=0;i--)
      {
      EMA2_HiLo_Buffer[i]=(1-S_ALFA)*EMA_HiLo_Buffer[i]+S_ALFA*EMA2_HiLo_Buffer[i+1];
      EMA2_OpCl_Buffer[i]=(1-S_ALFA)*EMA_OpCl_Buffer[i]+S_ALFA*EMA2_OpCl_Buffer[i+1];
      }
   for (i=limit-1;i>=0;i--)
      {
      ECO_Buffer[i]=100.0*EMA2_OpCl_Buffer[i]/EMA2_HiLo_Buffer[i];
      }
   for (i=limit-2;i>=0;i--)
      {
      Signal_Buffer[i]=iMAOnArray(ECO_Buffer,0,Signal,0,MODE_EMA,i);
      }
//---- TODO: add your code here

//----
   return(0);
  }
//+------------------------------------------------------------------+
Comments