Dynamic_Pivot_v3
Download script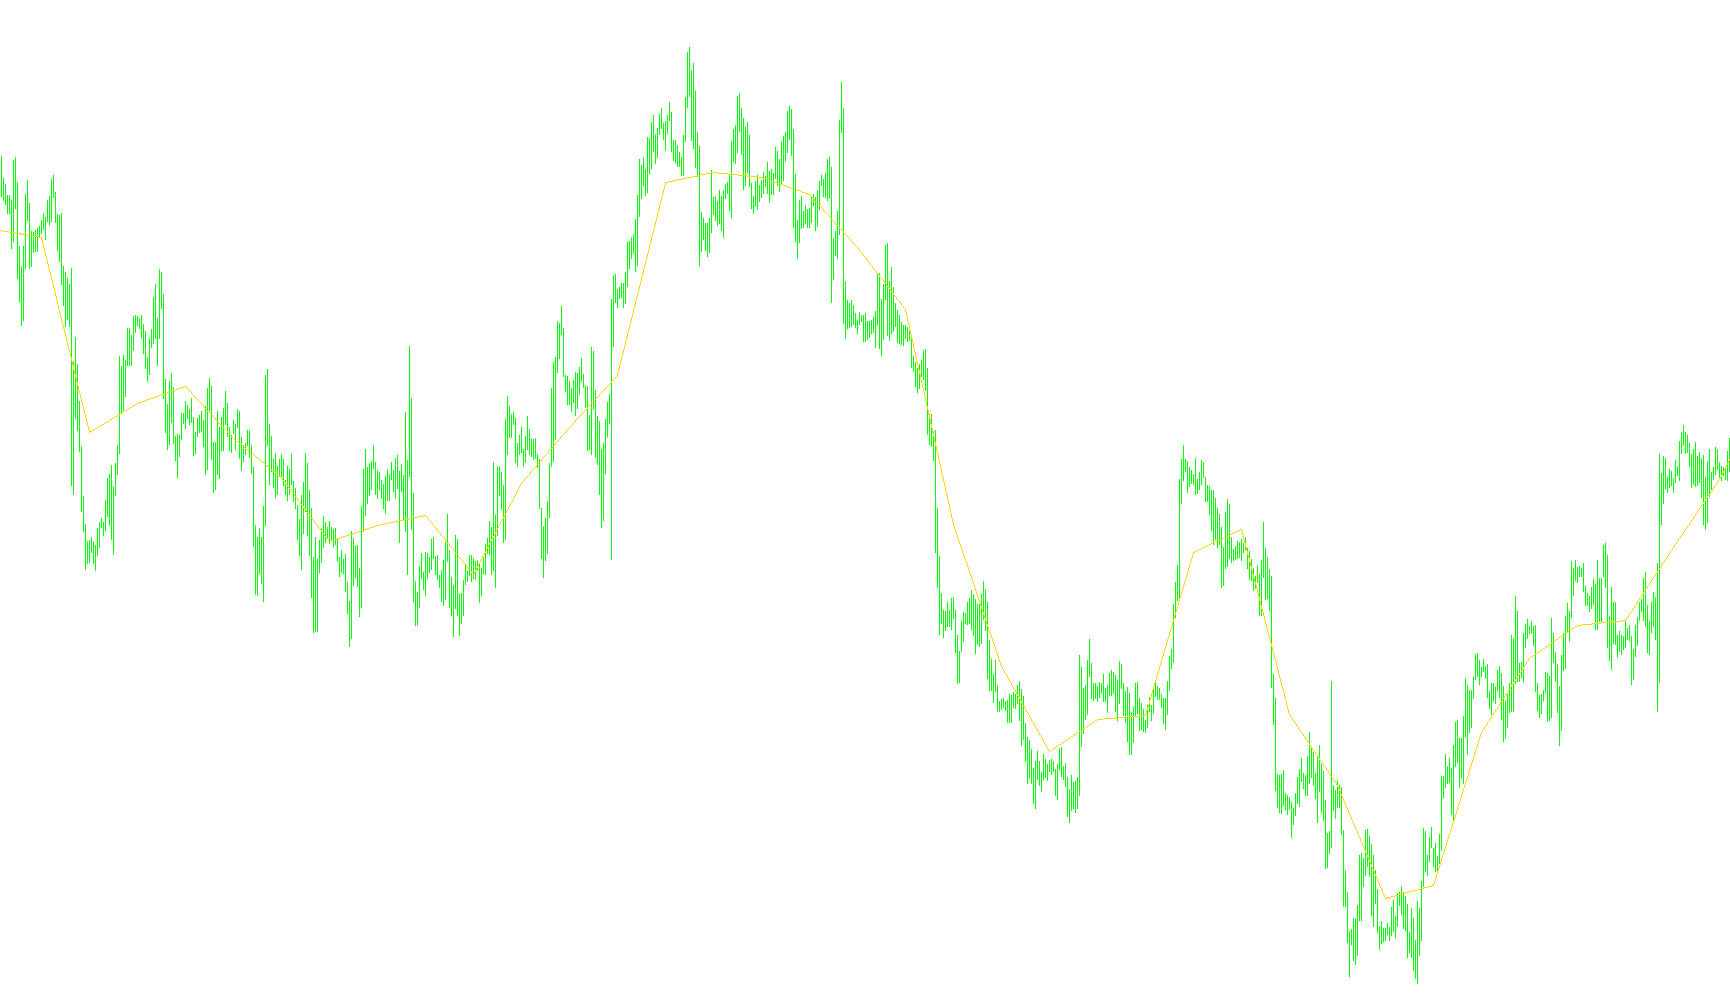
This script is designed as a technical analysis tool for the MetaTrader platform, specifically tailored to identify and display "Pivot Points" based on previous daily price action. Pivot points are key levels used by traders to determine potential support and resistance in the financial markets.
Core Functionality
The primary purpose of this tool is to automatically calculate and plot specific price levels derived from the highs, lows, and closing prices of preceding trading sessions. By identifying these levels, the script helps traders visualize where the market might react or reverse during a new trading day.
Key Logic Components
1. Dynamic Pivot Calculation The script analyzes the price data of previous days to determine two main values:
- Highest High: The peak price reached during the previous session.
- Lowest Low: The minimum price reached during the previous session.
Depending on the user's settings, the tool applies a specific mathematical formula to these figures along with the previous day's closing price to generate the Pivot Point. It offers two distinct calculation modes (Formula 0 and Formula 1), allowing users to choose between different weighting methods for the closing price.
2. New Day Detection The logic includes a specialized "New Day" filter. The script actively monitors the timestamp of each candle to recognize exactly when a new trading day begins. This ensures that the pivot levels are recalculated and updated at the correct moment, keeping the data relevant to the current market cycle.
3. Slope Analysis A unique feature of this script is its ability to calculate the "slope" of these pivot points. By looking back at a specific number of previous values, the tool determines the trend of the pivots themselves:
- Upward Slope: Indicates that the calculated pivot levels are rising.
- Downward Slope: Indicates that the calculated pivot levels are falling.
- Flat Slope: Indicates that the levels remain stable.
This directional analysis helps users understand whether the structural "balance" of the market is shifting higher or lower over time.
4. Visual Presentation and Optimization
- Timeframe Filtering: To maintain accuracy and clarity, the script is designed to function most effectively on lower timeframes (specifically those smaller than 4 hours).
- Real-time Updates: The tool includes a specialized function to handle "null" bars, ensuring that the visual data remains clean and does not create clutter during active trading.
- Dynamic Plotting: The results are displayed as a distinct section on your chart, visually highlighting the calculated levels so they can be easily integrated into a trading strategy.
Summary for the User
In essence, this script takes the "history" of the previous day and translates it into a specific price target for the current day. It doesn't just show you where the price was; it calculates where the market is likely to find support or resistance today, while also providing an underlying analysis of whether those levels are trending up, down, or staying level.
//+------------------------------------------------------------------+
//|                                                   ^Dyn_Pivot.mq4 |
//|                                      Modest, Rosh conversed only |
//|                           http://forexsystems.ru/phpBB/index.php |
//+------------------------------------------------------------------+
#property copyright "Modest, Rosh conversed only"
#property link      "http://forexsystems.ru/phpBB/index.php"

#property indicator_chart_window
#property indicator_buffers 1
#property indicator_color1 Blue
//---- input parameters
extern int       Formula=0;
extern int       lookBack=1;
int i=1, shift;
double FP=0.0;
double FH=0.0, FL=0.0;
bool result;
//---- buffers
double ExtMapBuffer1[];
//+------------------------------------------------------------------+
//| Ïðîâåðêà íîâîãî äíÿ                                              |
//+------------------------------------------------------------------+
bool isNewDay(int _shift)
  {
//----
   result=false;
   if (  (TimeHour(Time[_shift])==0)  && (TimeMinute(Time[_shift])==0)   ) result=true;

//----
   return(result);
  }
//+------------------------------------------------------------------+
//| Ïîëó÷èòü óðîâåíü FP ïðîøåäøåãî äíÿ                               |
//+------------------------------------------------------------------+
double GetFPofDay(int _shift)
  {
  int prevDay=TimeDay(Time[_shift+1]);
//----
   i=1;
   while (TimeDay(Time[_shift+i])==prevDay) i++;
   i--;
   FH=High[Highest(NULL,0,MODE_HIGH,i,_shift+1)];
   FL=Low[Lowest(NULL,0,MODE_LOW,i,_shift+1)];
   if (Formula==0) FP=NormalizeDouble((FH+FL+Close[_shift+1])/3.0,Digits); else FP=NormalizeDouble((FH+FL+2*Close[_shift+1])/4.0,Digits);
//----
   return(FP);
  }
//+------------------------------------------------------------------+
//| Ðàáîòà â íóëåâîì áàðå                                            |
//+------------------------------------------------------------------+
void SetNullBarValue(int _shift)
  {
  int cnt;
  int currDay=TimeDay(Time[_shift]);
//----
   i=1;
   while (TimeDay(Time[_shift+i])==currDay) i++;
   if (i>=2)
      {
      i=i-2;
      for (cnt=i;cnt>0;cnt--) ExtMapBuffer1[shift+cnt]=0.0;
      FH=High[Highest(NULL,0,MODE_HIGH,i+1,_shift)];
      FL=Low[Lowest(NULL,0,MODE_LOW,i+1,_shift)];

      if (Formula==0) {
         FP=NormalizeDouble((FH+FL+Close[_shift+1])/3.0,Digits);
      }else {
         FP=NormalizeDouble((FH+FL+2*Close[_shift+1])/4.0,Digits);
      }


      ExtMapBuffer1[_shift]=FP;
      }
//----
   return;
  }
//+------------------------------------------------------------------+
//| Custom indicator initialization function                         |
//+------------------------------------------------------------------+
int init()
  {
   if (Formula!=0)Formula=1;
   string label="FP("+Formula+")";
//---- indicators

   SetIndexStyle(0,DRAW_SECTION);
   SetIndexBuffer(0,ExtMapBuffer1);
   SetIndexEmptyValue(0,0.0);
   SetIndexLabel(0,label);

//----
   return(0);
  }
//+------------------------------------------------------------------+
//| Custor indicator deinitialization function                       |
//+------------------------------------------------------------------+
int deinit()
  {
//----

//----
   return(0);
  }
//+------------------------------------------------------------------+
//| Custom indicator iteration function                              |
//+------------------------------------------------------------------+
int start()
  {
   int limit,firstDay;
   int counted_bars=IndicatorCounted();
   if (counted_bars<0) return(0);
   if (counted_bars==0)
      {
      limit=Bars-1;
      i=1;
      firstDay=TimeDay(Time[limit]);
      while (TimeDay(Time[limit-i])==firstDay) i++;
      limit=limit-i-PERIOD_D1/Period();
      }
   if (counted_bars>0) limit=Bars-counted_bars;
//----
   if (Period()>PERIOD_H4) return;

   for (shift=limit;shift>=0;shift--) {

      if (isNewDay(shift)) {

         int slope = findSlope(shift);

         switch (slope) {

            case 2:
               // line sloping up
               break;
            case 1:
               // line sloping down
               break;
            case -1:
               // line is flat
               break;

         }

         ExtMapBuffer1[shift]=GetFPofDay(shift);
      } else  {
         ExtMapBuffer1[shift]=0.0;
      }

      if (shift==0) {
         SetNullBarValue(shift);
      }


   }
//----
   return(0);
  }
//+------------------------------------------------------------------+

int findSlope (int i) {

   int c, dir=0, lookBack;

   for (c=i+lookBack; c>=i; c--) {

      if (GetFPofDay(c) < GetFPofDay(c+1) && (dir == 1 || dir==0)) { // sloping down

        dir = 1;

      } else if (GetFPofDay(c) > GetFPofDay(c+1) && (dir == 1 || dir==0)) { // sloping up

        dir = 2;

      } else { // no slope

        dir = -1;

      }

   }

   return (dir);


}
Comments