Awesome_Signal_v1
Download script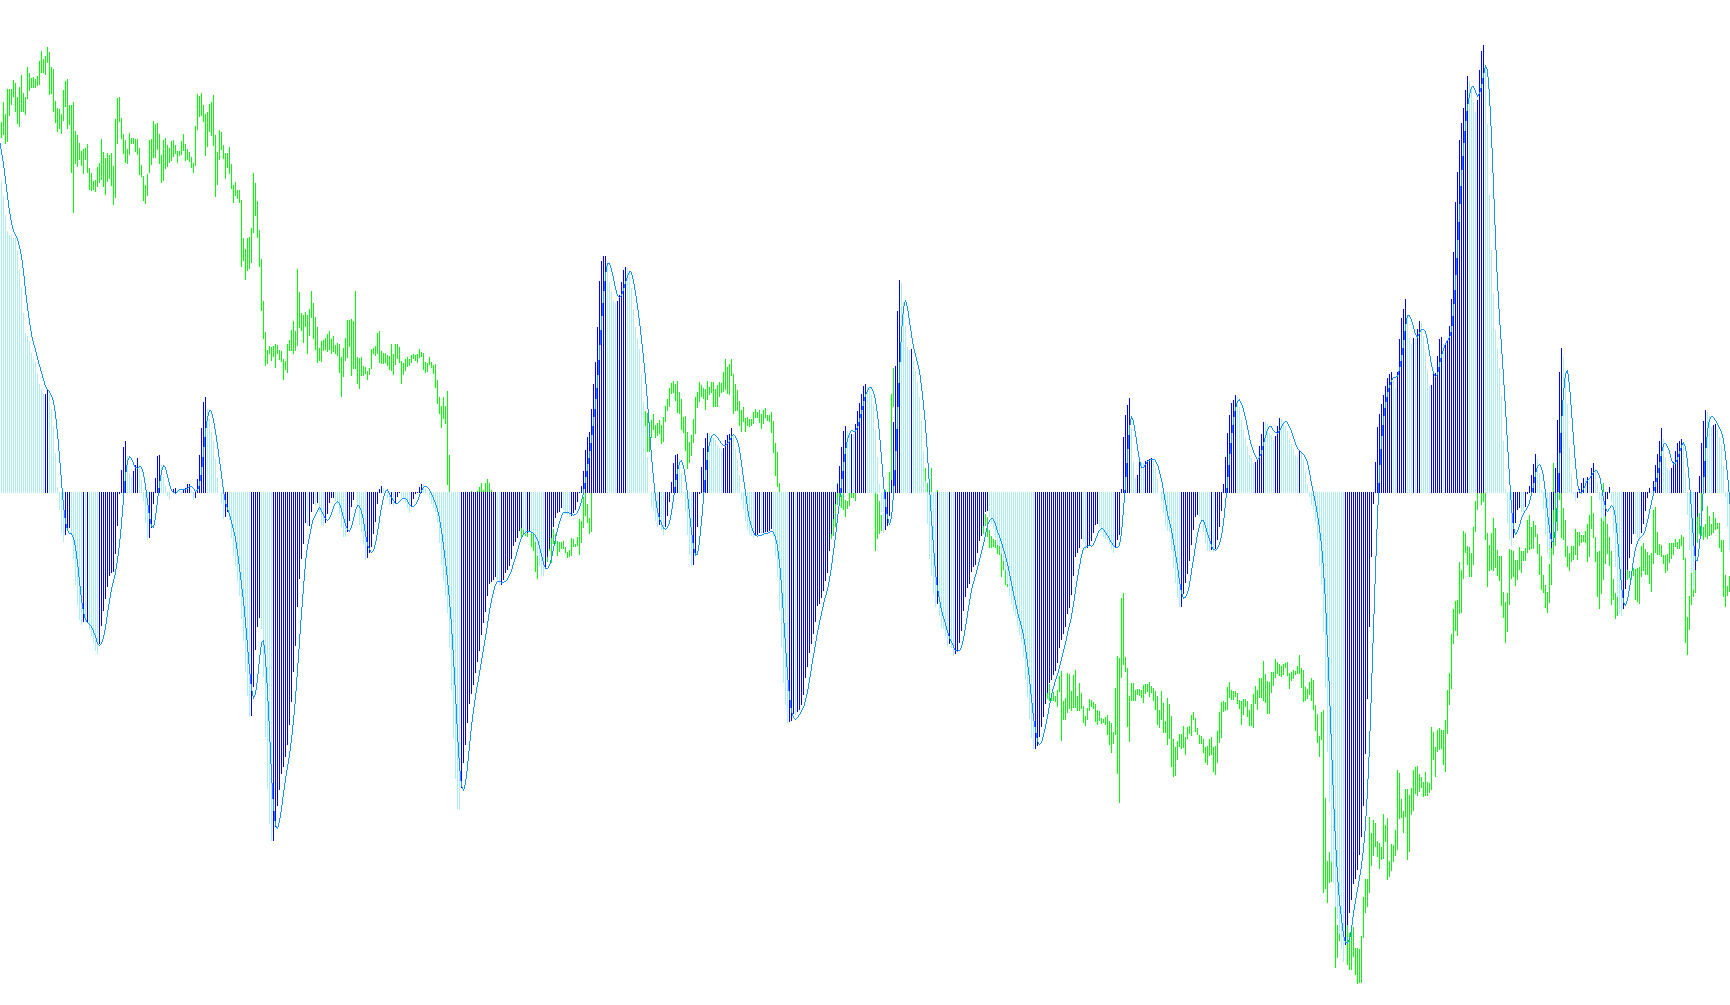
The Awesome Signal tool is a custom technical analysis indicator designed to help traders visualize market momentum and identify potential turning points in price action. It operates by transforming standard price data into a series of visual signals, making it easier to distinguish between steady trends and shifts in sentiment.
How the Logic Works
The core logic of this script is built on three distinct layers of data processing:
1. Momentum Calculation (The Foundation) The indicator begins by comparing two different moving averages of the market price—a "Fast" average and a "Slow" average. By calculating the difference between these two, the tool determines the current momentum. If the fast average is significantly higher than the slow average, it indicates upward strength; if lower, it indicates downward pressure.
2. Visual Trend Differentiation (The Histogram) Once the momentum is calculated, the script separates the data into two visual components:
- Upward Momentum: When the momentum is increasing or staying positive, the tool highlights this movement visually.
- Downward Momentum: When the momentum turns negative or begins to drop, the tool captures this shift separately. This allows traders to see "blocks" of sentiment, helping to identify whether a current move is gaining strength or starting to exhaust itself.
3. The Signal Line (The Smoothing Filter) To filter out the "noise" of constant price fluctuations, the script applies a final smoothing pass over the momentum data. This creates a secondary "Signal Line." Rather than reacting to every tiny tick in the market, this line provides a more stable, fluid path that follows the general direction of the trend.
Key Features for Users
- Customizable Sensitivity: The logic includes adjustable parameters for the Fast and Slow averages. This allows users to tune the indicator to be "twitchy" (reacting quickly to small changes) or "stable" (focusing on long-term trends).
- Signal Shifting: There is an option to shift the signal line forward or backward on the chart, providing flexibility in how the data aligns with current price candles.
- Visual Clarity: The script is designed to display these different data types clearly in a separate window, using distinct colors and styles (such as histograms vs. solid lines) so that the user can distinguish between raw momentum and smoothed signals at a glance.
//+------------------------------------------------------------------+
//|                                                      Awesome_Signal.mq4 |
//|                      Copyright © 2005, MetaQuotes Software Corp. |
//|                                       http://www.metaquotes.net/ |
//+------------------------------------------------------------------+

// Ðàñøèðåí è äîïîëíåí Asystem2000
// Ðàñøèðåíèå: ñòðîèòñÿ ñèãíàëüíàÿ ëèíèÿ
// Äîïîëíåíèÿ:
// 1. Ââåäåíà âîçìîæíîñòü íàñòðîéêè áûñòðîé, ìåäëåííîé è ñèãíàëüíîé ëèíèé
// 2. Ââåäåíà âîçìîæíîñòü íàñòðîéêè ñìåùåíèÿ ñèãíàëüíîé ëèíèè

#property  copyright "Copyright © 2005, MetaQuotes Software Corp."
#property  link      "http://www.metaquotes.net/"
//---- indicator settings
#property  indicator_separate_window
#property  indicator_buffers 4
#property  indicator_color1  Black
#property  indicator_color2  Green
#property  indicator_color3  Red
#property  indicator_color4  Gold

extern int Fast = 5;
extern int Slow = 34;
extern int Signal=5;
extern int SignalShift=0;

//---- indicator buffers
double     ExtBuffer0[];
double     ExtBuffer1[];
double     ExtBuffer2[];
double     SignalBuffer[];
//+------------------------------------------------------------------+
//| Custom indicator initialization function                         |
//+------------------------------------------------------------------+
int init()
  {
   //---- drawing settings
   SetIndexStyle(0,DRAW_NONE);
   SetIndexStyle(1,DRAW_HISTOGRAM);
   SetIndexStyle(2,DRAW_HISTOGRAM);
   SetIndexStyle(3,DRAW_LINE,STYLE_SOLID);
    SetIndexShift( 3, SignalShift);

   IndicatorDigits(Digits+1);
   SetIndexDrawBegin(0,34);
   SetIndexDrawBegin(1,34);
   SetIndexDrawBegin(2,34);
   SetIndexDrawBegin(3,34);

//---- 3 indicator buffers mapping
   SetIndexBuffer(0,ExtBuffer0);
   SetIndexBuffer(1,ExtBuffer1);
   SetIndexBuffer(2,ExtBuffer2);
   SetIndexBuffer(3,SignalBuffer);
//---- name for DataWindow and indicator subwindow label
   IndicatorShortName("AO");
   SetIndexLabel(1,NULL);
   SetIndexLabel(2,NULL);
//---- initialization done
   return(0);
  }
//+------------------------------------------------------------------+
//| Awesome Oscillator                                               |
//+------------------------------------------------------------------+
int start()
  {
   int    limit;
   int    counted_bars=IndicatorCounted();
   double prev,current;
//---- last counted bar will be recounted
   if(counted_bars>0) counted_bars--;
   limit=Bars-counted_bars;
//---- macd
   for(int i=0; i<limit; i++)
      ExtBuffer0[i]=iMA(NULL,0,Fast,0,MODE_SMA,PRICE_MEDIAN,i)-iMA(NULL,0,Slow,0,MODE_SMA,PRICE_MEDIAN,i);
//---- dispatch values between 2 buffers
   bool up=true;
   for(i=limit-1; i>=0; i--)
     {
      current=ExtBuffer0[i];
      prev=ExtBuffer0[i+1];
      if(current>prev) up=true;
      if(current<prev) up=false;
      if(!up)
        {
         ExtBuffer2[i]=current;
         ExtBuffer1[i]=0.0;
        }
      else
        {
         ExtBuffer1[i]=current;
         ExtBuffer2[i]=0.0;
        }
     }
// ----- Draw signal
    for(i=0; i<limit; i++)
         SignalBuffer[i]=iMAOnArray(ExtBuffer0,Bars,Signal,0,MODE_SMA,i);
//---- done
   return(0);
  }
//+------------------------------------------------------------------+
Comments