BandsMA2dev
Download script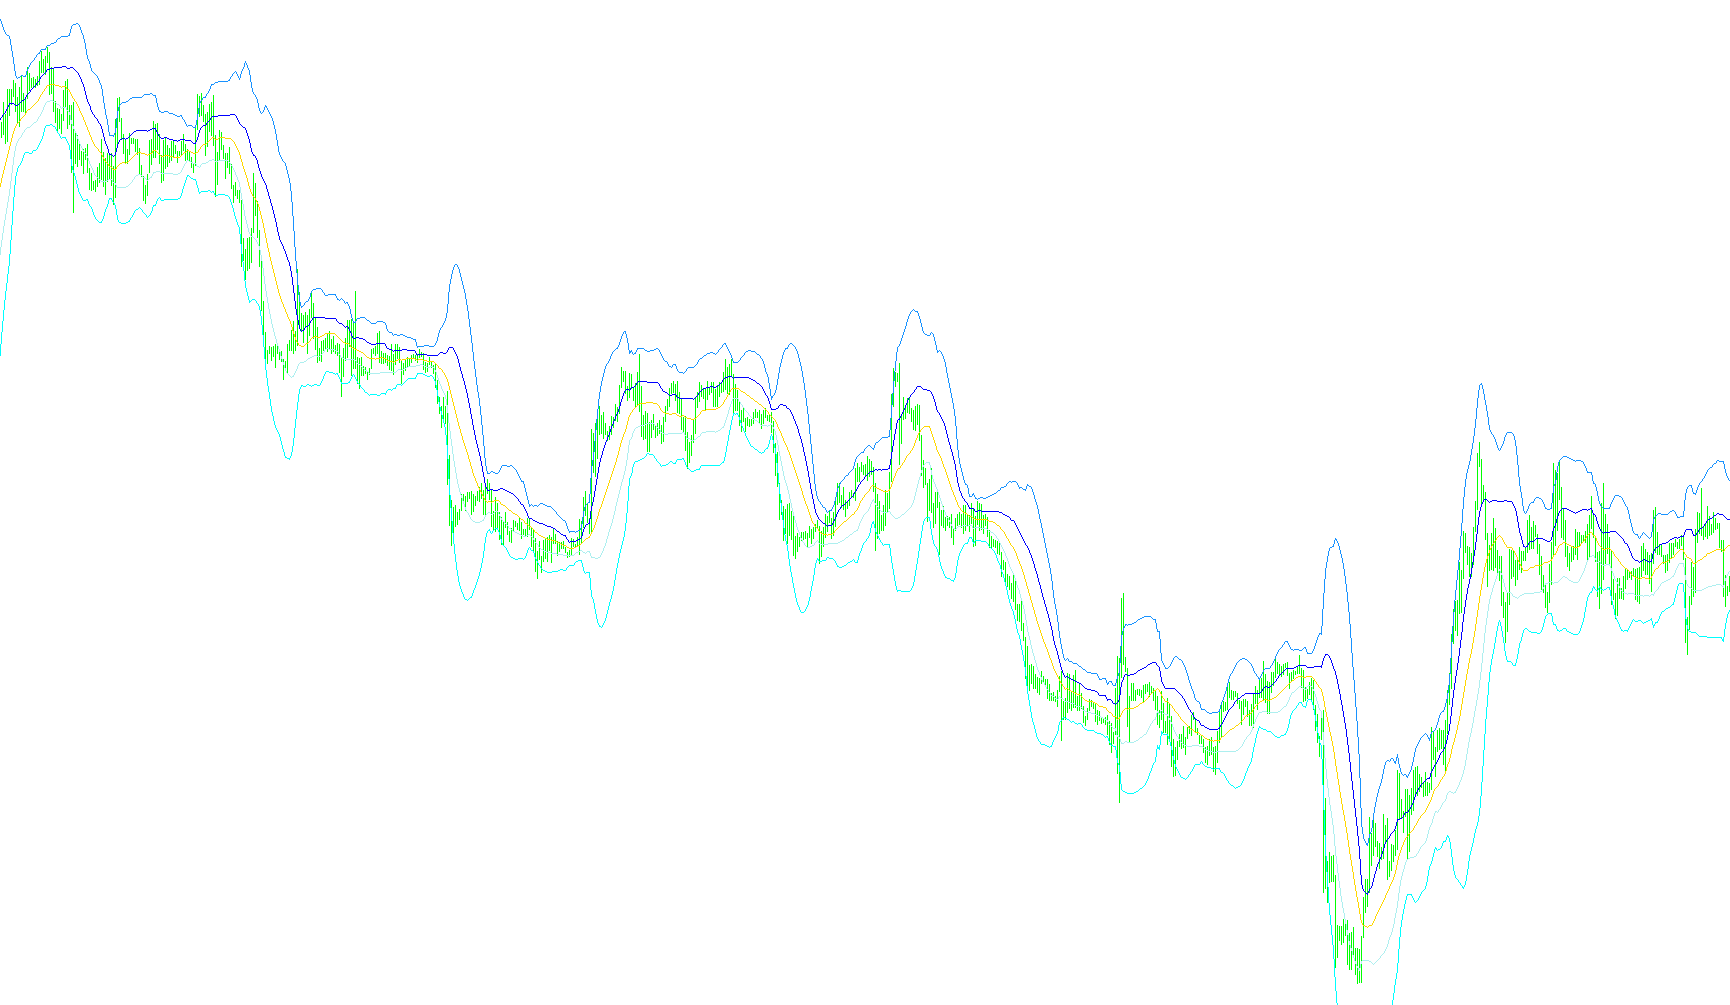
This script is a technical analysis tool designed for the MetaTrader platform. Its primary purpose is to calculate and visualize specialized "Bands" on a price chart, which help traders identify potential overbought or oversold conditions by measuring volatility and price trends simultaneously.
Core Functionality
The tool operates by taking a standard moving average—which tracks the general direction of price—and projecting two sets of boundaries (upper and lower bands) around it. These boundaries expand or contract based on how much the price fluctuates relative to that moving average.
Key Features and Customization
1. Versatile Moving Average Options Unlike basic tools that use only one type of average, this script allows users to choose from several different mathematical models to determine the "center" line:
- Simple (SMA)
- Exponential (EMA)
- Smoothed (SMMA)
- Linear Weighted (LWMA)
- Least Squares (LSMA) — a specialized linear regression average.
2. Flexible Price Sources The calculation can be based on different types of price data, allowing for more nuanced analysis depending on the trader's strategy:
- Standard prices like Open, High, Low, or Close.
- Derived prices such as the Median (Average of High and Low), Typical (Average of High, Low, and Close), or Weighted prices.
3. Dual Band System The script generates two distinct sets of bands for every calculation:
- Inner Bands: Calculated using a primary deviation setting.
- Outer Bands: Calculated using a secondary deviation setting. By providing two different layers of bands, the tool allows traders to see multiple zones of interest—for example, identifying "moderate" volatility versus "extreme" volatility.
How it Works Visually
When applied to a chart, the script draws:
- A Middle Line (optional), representing the current trend based on your chosen average.
- Two sets of Upper and Lower Lines, which create a "channel" around the middle line.
As market volatility increases, these bands will widen; during periods of calm, they will tighten. This provides a visual representation of the "normal" trading range for the selected period, helping users spot when the price is moving outside of its usual behavior.
//+------------------------------------------------------------------+
//|                                                        Bands.mq4 |
//|                      Copyright © 2005, MetaQuotes Software Corp. |
//|                                       http://www.metaquotes.net/ |
//| Modified by Robert Hill to use any MA including LSMA             |
//|  instead of SMA                                                  |
//+------------------------------------------------------------------+
#property copyright "Copyright © 2005, MetaQuotes Software Corp."
#property link      "http://www.metaquotes.net/"

#property indicator_chart_window
#property indicator_buffers 5
#property indicator_color1 Yellow
#property indicator_color2 LightSeaGreen
#property indicator_color3 LightSeaGreen
#property indicator_color4 Red
#property indicator_color5 Red
//---- indicator parameters
extern string  m = "--Moving Average Types--";
extern string  m0 = " 0 = SMA";
extern string  m1 = " 1 = EMA";
extern string  m2 = " 2 = SMMA";
extern string  m3 = " 3 = LWMA";
extern string  m4 = " 4 = LSMA";
extern int     MA_Type=0;
extern string  p = "--Applied Price Types--";
extern string  p0 = " 0 = close";
extern string  p1 = " 1 = open";
extern string  p2 = " 2 = high";
extern string  p3 = " 3 = low";
extern string  p4 = " 4 = median(high+low)/2";
extern string  p5 = " 5 = typical(high+low+close)/3";
extern string  p6 = " 6 = weighted(high+low+close+close)/4";
extern int     MA_AppliedPrice = 0;
extern string  b = "--Bands Inputs--";
extern int     BandsPeriod=20;
extern int     BandsShift=0;
extern double  BandsDeviations1 = 1.0;
extern double  BandsDeviations2 = 2.5;
extern bool    DisplayMidLine = true;

//---- buffers
double MovingBuffer[];
double UpperBuffer1[];
double LowerBuffer1[];
double UpperBuffer2[];
double LowerBuffer2[];

//---- variables

int    MA_Mode;
string strMAType;

//+------------------------------------------------------------------+
//| Custom indicator initialization function                         |
//+------------------------------------------------------------------+
int init()
  {
//---- indicators
   SetIndexStyle(0,DRAW_LINE);
   SetIndexBuffer(0,MovingBuffer);
   SetIndexStyle(1,DRAW_LINE);
   SetIndexBuffer(1,UpperBuffer1);
   SetIndexStyle(2,DRAW_LINE);
   SetIndexBuffer(2,LowerBuffer1);
   SetIndexStyle(3,DRAW_LINE);
   SetIndexBuffer(3,UpperBuffer2);
   SetIndexStyle(4,DRAW_LINE);
   SetIndexBuffer(4,LowerBuffer2);
//----
   SetIndexDrawBegin(0,BandsPeriod+BandsShift);
   SetIndexDrawBegin(1,BandsPeriod+BandsShift);
   SetIndexDrawBegin(2,BandsPeriod+BandsShift);
   SetIndexDrawBegin(3,BandsPeriod+BandsShift);
   SetIndexDrawBegin(4,BandsPeriod+BandsShift);
//----

switch (MA_Type)
   {
      case 1: strMAType="EMA"; MA_Mode=MODE_EMA; break;
      case 2: strMAType="SMMA"; MA_Mode=MODE_SMMA; break;
      case 3: strMAType="LWMA"; MA_Mode=MODE_LWMA; break;
      case 4: strMAType="LSMA"; break;
      default: strMAType="SMA"; MA_Mode=MODE_SMA; break;
   }
   IndicatorShortName( strMAType+ " (" +BandsPeriod + ") ");

   return(0);
  }

//+------------------------------------------------------------------------+
//| LSMA - Least Squares Moving Average function calculation               |
//| LSMA_In_Color Indicator plots the end of the linear regression line    |
//+------------------------------------------------------------------------+

//+------------------------------------------------------------------+
//| LSMA with PriceMode                                              |
//| PrMode  0=close, 1=open, 2=high, 3=low, 4=median(high+low)/2,    |
//| 5=typical(high+low+close)/3, 6=weighted(high+low+close+close)/4  |
//+------------------------------------------------------------------+

double LSMA(int TimeFrame, int Rperiod, int prMode, int shift)
{
   int i, myShift;
   double sum, pr;
   int length;
   double lengthvar;
   double tmp;
   double wt;

   length = Rperiod;

   sum = 0;
   for(i = length; i >= 1  ; i--)
   {
     lengthvar = length + 1;
     lengthvar /= 3;
     tmp = 0;
     myShift = length - i + shift;
     switch (prMode)
     {
     case 0: pr = iClose(NULL,TimeFrame,myShift);break;
     case 1: pr = iOpen(NULL,TimeFrame,myShift);break;
     case 2: pr = iHigh(NULL,TimeFrame,myShift);break;
     case 3: pr = iLow(NULL,TimeFrame,myShift);break;
     case 4: pr = (iHigh(NULL,TimeFrame,myShift) + iLow(NULL,TimeFrame,myShift))/2;break;
     case 5: pr = (iHigh(NULL,TimeFrame,myShift) + iLow(NULL,TimeFrame,myShift) + iClose(NULL,TimeFrame,myShift))/3;break;
     case 6: pr = (iHigh(NULL,TimeFrame,myShift) + iLow(NULL,TimeFrame,myShift) + iClose(NULL,TimeFrame,myShift) + iClose(NULL,TimeFrame,myShift))/4;break;
     }
     tmp = ( i - lengthvar)*pr;
     sum+=tmp;
    }
    wt = sum*6/(length*(length+1));
    wt = MathFloor(wt/Point)*Point;

    return(wt);
}

//+------------------------------------------------------------------+
//| Bollinger Bands                                                  |
//+------------------------------------------------------------------+
int start()
  {
   int    i,k,counted_bars=IndicatorCounted();
   double deviation1, deviation2;
   double sum,oldval,newres;
//----
   if(Bars<=BandsPeriod) return(0);
//---- initial zero
   if(counted_bars<1)
      for(i=1;i<=BandsPeriod;i++)
        {
         MovingBuffer[Bars-i]=EMPTY_VALUE;
         UpperBuffer1[Bars-i]=EMPTY_VALUE;
         LowerBuffer1[Bars-i]=EMPTY_VALUE;
         UpperBuffer2[Bars-i]=EMPTY_VALUE;
         LowerBuffer2[Bars-i]=EMPTY_VALUE;
        }
//----
   int limit=Bars-counted_bars;
   if(counted_bars>0) limit++;
   for(i=0; i<limit; i++)
   {
     if (MA_Type == 4)
      MovingBuffer[i]=LSMA(0, BandsPeriod, MA_AppliedPrice,i);
     else
      MovingBuffer[i]=iMA(NULL,0,BandsPeriod,BandsShift,MA_Mode,MA_AppliedPrice,i);
   }
//----
   i=Bars-BandsPeriod+1;
   if(counted_bars>BandsPeriod-1) i=Bars-counted_bars-1;
   while(i>=0)
     {
      sum=0.0;
      k=i+BandsPeriod-1;
      oldval=MovingBuffer[i];
      while(k>=i)
        {
         newres=Close[k]-oldval;
         sum+=newres*newres;
         k--;
        }
      deviation1=BandsDeviations1*MathSqrt(sum/BandsPeriod);
      deviation2=BandsDeviations2*MathSqrt(sum/BandsPeriod);
      UpperBuffer1[i]=oldval+deviation1;
      LowerBuffer1[i]=oldval-deviation1;
      UpperBuffer2[i]=oldval+deviation2;
      LowerBuffer2[i]=oldval-deviation2;
      i--;
     }
   if (DisplayMidLine == false)
   {
      for(i=1;i<=Bars;i++)
         MovingBuffer[i]=EMPTY_VALUE;
   }
   //----
   return(0);
  }
//+------------------------------------------------------------------+
Comments