This script is designed to visually represent potential trading signals based on the Relative Strength Index (RSI) across different timeframes on a trading chart.
Here's the breakdown:
-
Purpose: The script's primary goal is to display directional arrows on the chart indicating whether the RSI suggests a potential upward (buy) or downward (sell) movement. It does this by analyzing RSI values calculated for different timeframes simultaneously.
-
Timeframes: The script considers up to four different timeframes. These timeframes could be 15-minute, 30-minute, 1-hour, and 4-hour charts, but these are configurable. The script analyzes each timeframe independently.
-
RSI Calculation: For each timeframe, the script calculates the RSI. RSI is a momentum indicator that measures the magnitude of recent price changes to evaluate overbought or oversold conditions in the price of a stock or other asset.
-
Signal Generation: Based on the RSI value for each timeframe, the script generates a signal:
- If the RSI is below 50, it's interpreted as a potential upward trend, and an upward-pointing arrow is displayed.
- If the RSI is at or above 50, it's interpreted as a potential downward trend, and a downward-pointing arrow is displayed.
-
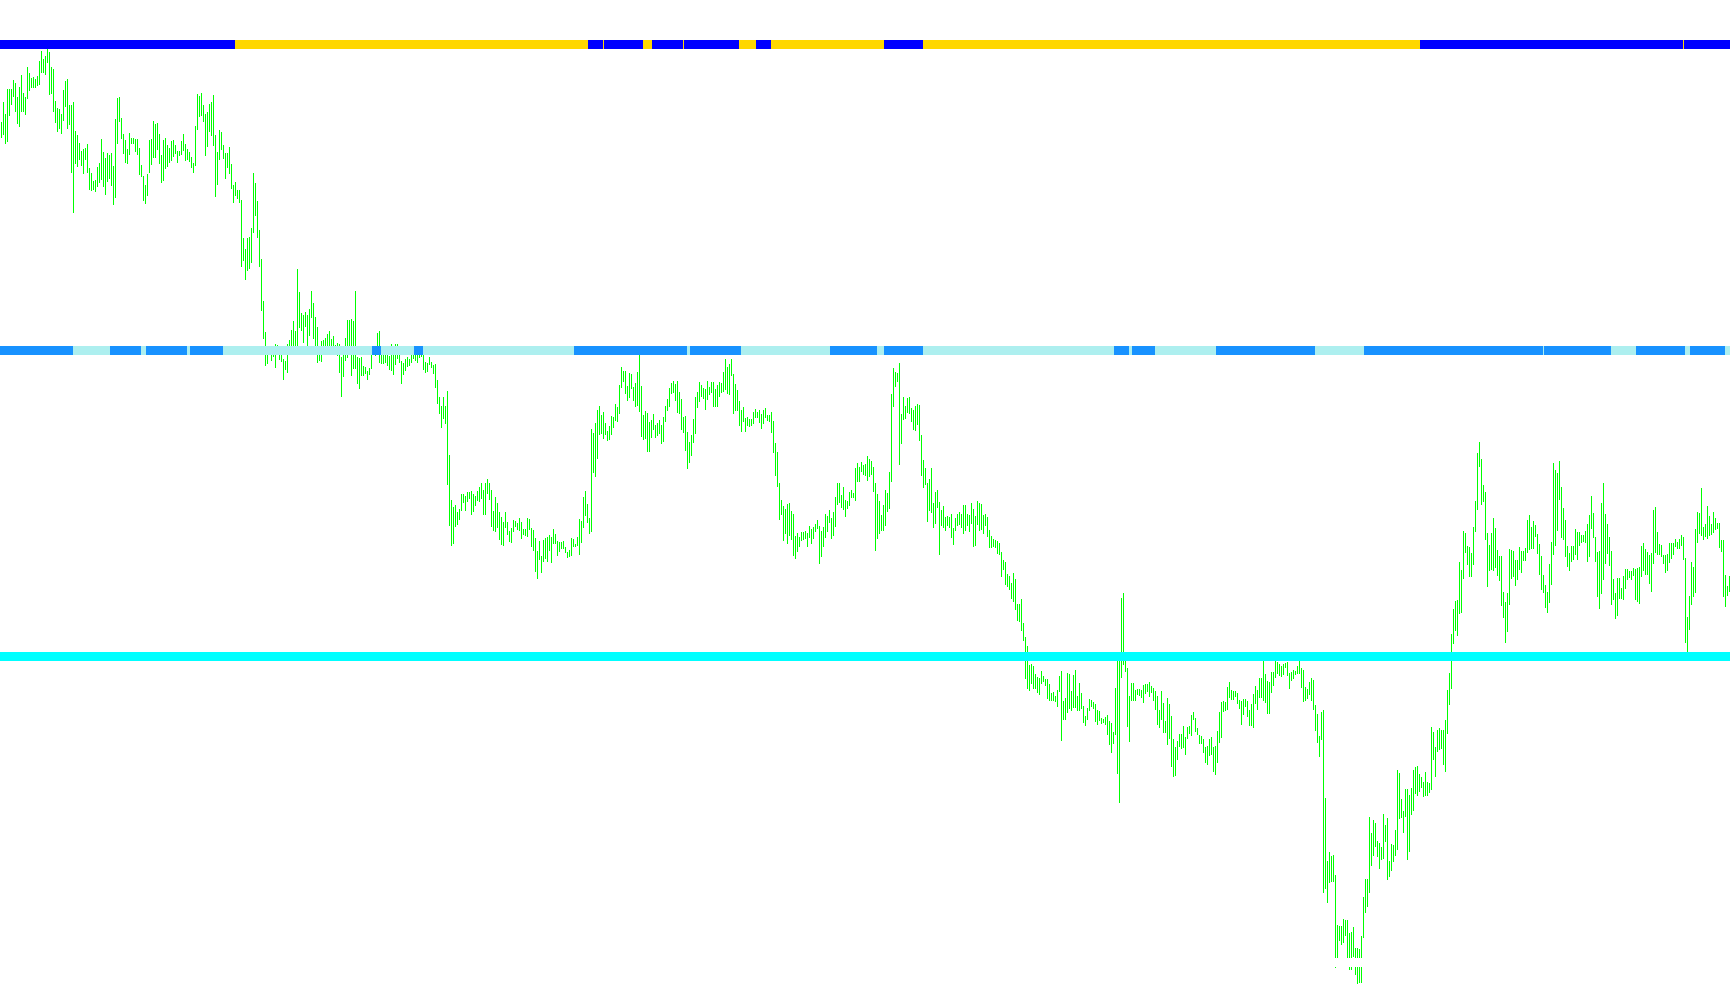
Visual Representation: The script displays these signals as directional arrows directly on the chart. Each timeframe's signal is displayed on a separate horizontal line, with a configurable gap between the lines.
-
Dynamic Timeframe Adjustment (Optional): The script includes an option for "AutoDisplay." If enabled, the script attempts to automatically choose appropriate timeframes to analyze based on the current chart's timeframe. This is designed to provide relevant signals without manual configuration.
-
Text Labels: The script also adds text labels to identify the timeframes being displayed.
In essence, this script provides a multi-timeframe RSI-based directional bias, visually displayed with arrows. Traders can use these arrows to quickly assess the potential direction of the asset based on RSI values across different timeframes.
//+------------------------------------------------------------------+
//|                                          #MTF Supertrend Bar.mq4 |
//|                                      Copyright © 2006, Eli hayun |
//|                                          http://www.elihayun.com |
//|Modified by CEO for potential use with Bagovino Method, simple change to RSI
//+------------------------------------------------------------------+
#property copyright "Copyright © 2006, Eli hayun"
#property link      "http://www.elihayun.com"

#property indicator_separate_window
#property indicator_minimum -1
//#property indicator_maximum 5
#property indicator_buffers 8
#property indicator_color1 Red
#property indicator_color2 Blue
#property indicator_color3 Red
#property indicator_color4 Blue
#property indicator_color5 Red
#property indicator_color6 Blue
#property indicator_color7 Red
#property indicator_color8 Blue
//---- buffers
double buf4_up[];
double buf4_down[];
double buf3_up[];
double buf3_down[];
double buf2_up[];
double buf2_down[];
double buf1_up[];
double buf1_down[];

extern double Gap = 1; // Gap between the lines of bars

extern int Period_1 = PERIOD_M15;
extern int Period_2 = PERIOD_M30;
extern int Period_3 = PERIOD_H1;
extern int Period_4 = PERIOD_H4;

extern bool AutoDisplay      = false;

string shortname = "";
bool firstTime = true;

int UniqueNum = 228;

//+------------------------------------------------------------------+
//| Custom indicator initialization function                         |
//+------------------------------------------------------------------+
int init()
  {


   SetAutoDisplay();


   shortname = "BagovinoBar("+Period_1+","+Period_2+","+Period_3+","+Period_4+")";
   firstTime = true;

   IndicatorShortName(shortname);
//---- indicators
   SetIndexStyle(0,DRAW_ARROW);
   SetIndexArrow(0,110);
   SetIndexBuffer(0,buf4_up);
   SetIndexEmptyValue(0,0.0);
   SetIndexStyle(1,DRAW_ARROW);
   SetIndexArrow(1,110);
   SetIndexBuffer(1,buf4_down);
   SetIndexEmptyValue(1,0.0);
   SetIndexStyle(2,DRAW_ARROW);
   SetIndexArrow(2,110);
   SetIndexBuffer(2,buf3_up);
   SetIndexEmptyValue(2,0.0);
   SetIndexStyle(3,DRAW_ARROW);
   SetIndexArrow(3,110);
   SetIndexBuffer(3,buf3_down);
   SetIndexEmptyValue(3,0.0);
   SetIndexStyle(4,DRAW_ARROW);
   SetIndexArrow(4,110);
   SetIndexBuffer(4,buf2_up);
   SetIndexEmptyValue(4,0.0);
   SetIndexStyle(5,DRAW_ARROW);
   SetIndexArrow(5,110);
   SetIndexBuffer(5,buf2_down);
   SetIndexEmptyValue(5,0.0);
   SetIndexStyle(6,DRAW_ARROW);
   SetIndexArrow(6,110);
   SetIndexBuffer(6,buf1_up);
   SetIndexEmptyValue(6,0.0);
   SetIndexStyle(7,DRAW_ARROW);
   SetIndexArrow(7,110);
   SetIndexBuffer(7,buf1_down);
   SetIndexEmptyValue(7,0.0);
//----
   return(0);
  }
//+------------------------------------------------------------------+
//| Custom indicator deinitialization function                       |
//+------------------------------------------------------------------+
int deinit()
  {
//----
   SetAutoDisplay();

   shortname = "BagovinoBar("+Period_1+","+Period_2+","+Period_3+","+Period_4+")";
   firstTime = true;
//----
   return(0);
  }
//+------------------------------------------------------------------+
//| Custom indicator iteration function                              |
//+------------------------------------------------------------------+
int start()
  {
   int    counted_bars=IndicatorCounted();
   int i=0, y15m=0, y4h=0, y1h=0, y30m=0, yy;
   int limit=Bars-counted_bars;

   datetime TimeArray_4H[], TimeArray_1H[], TimeArray_30M[], TimeArray_15M[];
//----


   if (firstTime || NewBar())
   {
      firstTime = false;
      int win = UniqueNum; // WindowFind(shortname);
      double dif = Time[0] - Time[1];
      for (int ii=ObjectsTotal()-1; ii>-1; ii--)
      {
         if (StringFind(ObjectName(ii),"FF_"+win+"_") >= 0)
            ObjectDelete(ObjectName(ii));
         else
            ii=-1;
      }

      double shift = 0.2;
      for (ii=0; ii<4; ii++)
      {
         string txt = "??";
         double gp;
         switch (ii)
         {
            case 0: txt = tf2txt(Period_1);  gp = 1 + shift;         break;
            case 1: txt = tf2txt(Period_2);  gp = 1 + Gap + shift;   break;
            case 2: txt = tf2txt(Period_3);  gp = 1 + Gap*2 + shift; break;
            case 3: txt = tf2txt(Period_4);  gp = 1 + Gap*3 + shift; break;
         }
         string name = "FF_"+win+"_"+ii+"_"+txt;
         ObjectCreate(name, OBJ_TEXT, WindowFind(shortname), iTime(NULL,0,0)+dif*3, gp);
         ObjectSetText(name, txt,8,"Arial", Black);
      }
   }

   ArrayCopySeries(TimeArray_4H,MODE_TIME,Symbol(),Period_4);
   ArrayCopySeries(TimeArray_1H,MODE_TIME,Symbol(),Period_3);
   ArrayCopySeries(TimeArray_30M,MODE_TIME,Symbol(),Period_2);
   ArrayCopySeries(TimeArray_15M,MODE_TIME,Symbol(),Period_1);

   for(i=0, y15m=0,  y4h=0,  y1h=0,  y30m=0;i<limit;i++)
   {
      if (Time[i]<TimeArray_15M[y15m]) y15m++;
      if (Time[i]<TimeArray_4H[y4h])   y4h++;
      if (Time[i]<TimeArray_1H[y1h])   y1h++;
      if (Time[i]<TimeArray_30M[y30m]) y30m++;

      for (int tf = 0; tf < 4; tf++)
      {
         int prd;
         switch (tf)
         {
            case 0: prd = Period_1; yy = y15m;  break;
            case 1: prd = Period_2; yy = y30m;  break;
            case 2: prd = Period_3;  yy = y1h;   break;
            case 3: prd = Period_4;  yy = y4h;   break;
         }

         double rsi = iRSI(NULL, prd, 21,PRICE_CLOSE, yy);
         double dUp = EMPTY_VALUE; //   iCustom(NULL, prd, "SuperTrend", false, 1, yy);
         double dDn = EMPTY_VALUE; //iCustom(NULL, prd, "SuperTrend", false, 0, yy);

         if (rsi < 50) dUp = 1; else dDn = 1;

         switch (tf)
         {
            case 0: if (dUp == EMPTY_VALUE)  buf1_down[i] = 1;           else buf1_up[i] = 1; break;
            case 1: if (dUp == EMPTY_VALUE)  buf2_down[i] = 1 + Gap * 1; else buf2_up[i] = 1 + Gap * 1; break;
            case 2: if (dUp == EMPTY_VALUE)  buf3_down[i]  = 1 + Gap * 2; else buf3_up[i]  = 1 + Gap * 2; break;
            case 3: if (dUp == EMPTY_VALUE)  buf4_down[i]  = 1  + Gap * 3; else buf4_up[i]  = 1 + Gap * 3; break;
         }


      }


   }

   return(0);
  }
//+------------------------------------------------------------------+

string tf2txt(int tf)
{
   if (tf == PERIOD_M1)    return("M1");
   if (tf == PERIOD_M5)    return("M5");
   if (tf == PERIOD_M15)    return("M15");
   if (tf == PERIOD_M30)    return("M30");
   if (tf == PERIOD_H1)    return("H1");
   if (tf == PERIOD_H4)    return("H4");
   if (tf == PERIOD_D1)    return("D1");
   if (tf == PERIOD_W1)    return("W1");
   if (tf == PERIOD_MN1)    return("MN1");

   return("??");
}

void SetValues(int p1, int p2, int p3, int p4)
{
   Period_1 = p1;   Period_2 = p2; Period_3 = p3; Period_4 = p4;
}


void SetAutoDisplay()
{
   if (AutoDisplay)
   {
      switch (Period())
      {
         case PERIOD_M1  :  SetValues(PERIOD_M1,  PERIOD_M5, PERIOD_M15,PERIOD_M30); break;
         case PERIOD_M5  :  SetValues(PERIOD_M5,  PERIOD_M15,PERIOD_M30,PERIOD_H1); break;
         case PERIOD_M15 :  SetValues(PERIOD_M5,  PERIOD_M15,PERIOD_M30,PERIOD_H1); break;
         case PERIOD_M30 :  SetValues(PERIOD_M5, PERIOD_M15,PERIOD_M30, PERIOD_H1); break;
         case PERIOD_H1  :  SetValues(PERIOD_M15, PERIOD_M30,PERIOD_H1, PERIOD_H4);  break;
         case PERIOD_H4  :  SetValues(PERIOD_M30, PERIOD_H1, PERIOD_H4, PERIOD_D1);  break;
         case PERIOD_D1  :  SetValues(PERIOD_H1,  PERIOD_H4, PERIOD_D1, PERIOD_W1); break;
         case PERIOD_W1  :  SetValues(PERIOD_H4,  PERIOD_D1, PERIOD_W1,PERIOD_MN1); break;
         case PERIOD_MN1 :  SetValues(PERIOD_H4,  PERIOD_D1, PERIOD_W1,PERIOD_MN1);  break;
      }
   }

}

bool NewBar()
{
   static datetime dt = 0;

   if (Time[0] != dt)
   {
      dt = Time[0];
      return(true);
   }
   return(false);
}
Comments