BandsLSMA_v2
Download script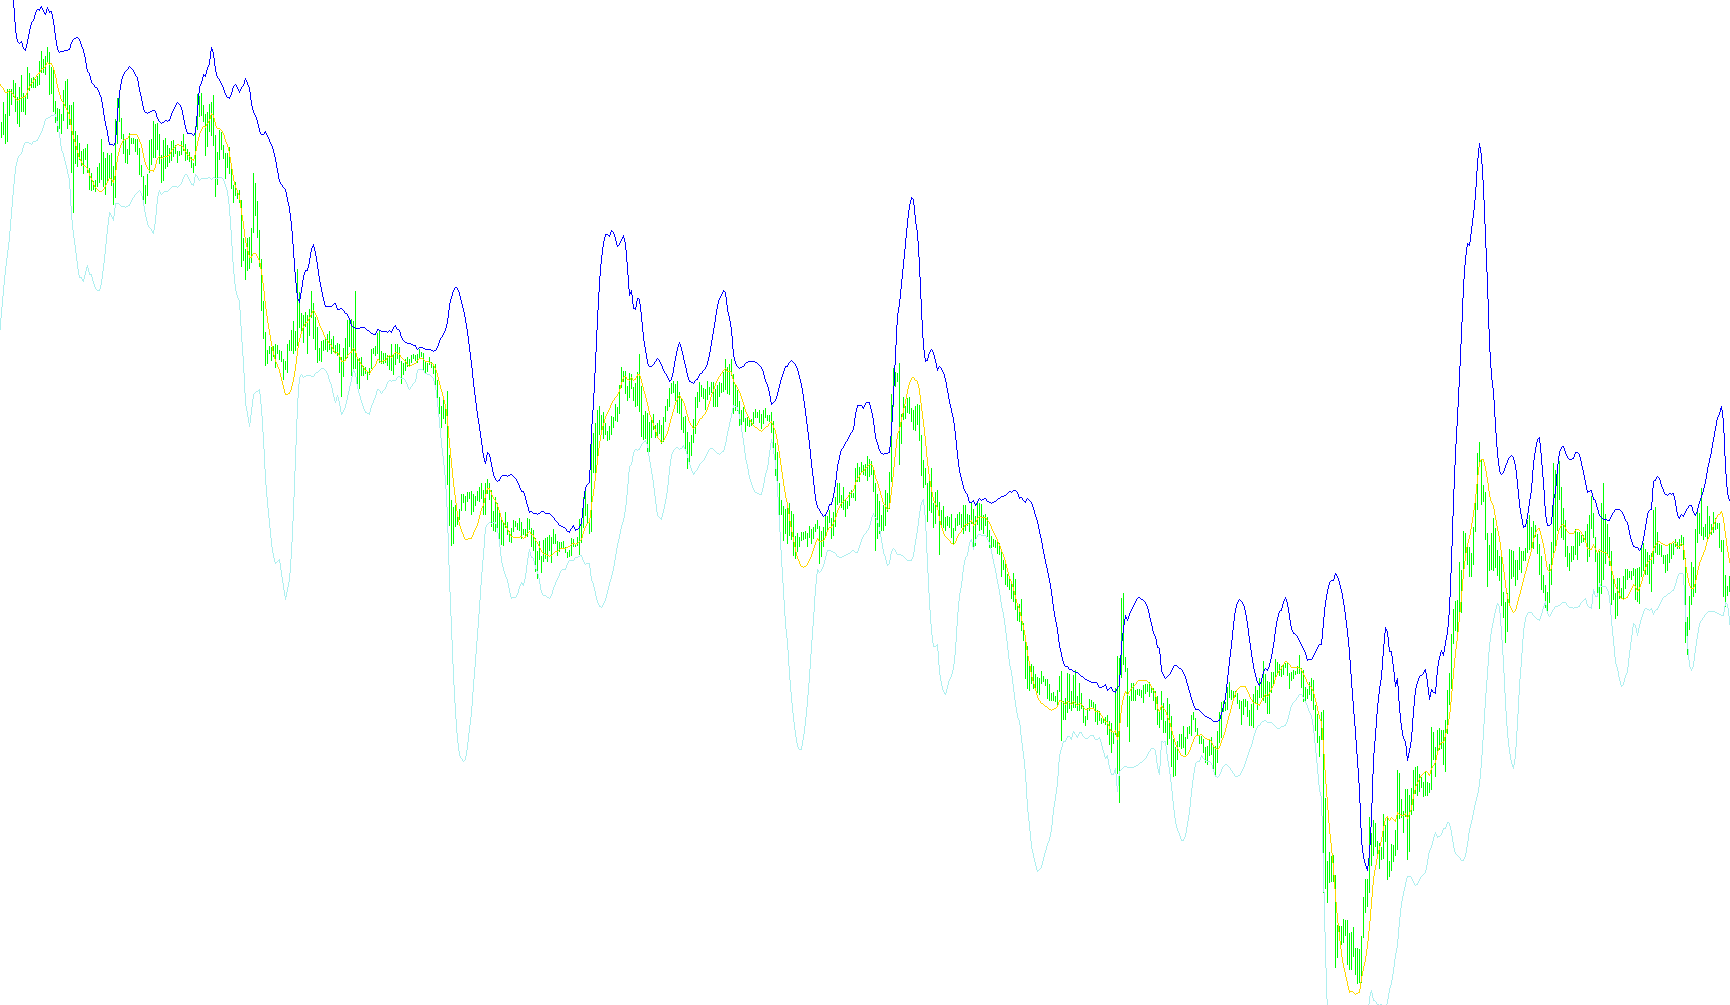
This tool is designed to provide a visual representation of market trends and volatility by combining two distinct mathematical concepts: the Least Squares Moving Average (LSMA) and a dynamic banding system. Instead of simply reacting to the most recent price action, this script attempts to identify the underlying "path" of the price to help traders distinguish between temporary noise and sustained momentum.
Core Components of the Logic
1. The Linear Regression Foundation (LSMA) The primary line in the center of the indicator represents the Least Squares Moving Average. Unlike a standard moving average, which simply averages previous prices, the LSMA works like a "best-fit" line. It calculates a linear regression over a specific period to determine the most accurate straight line that passes through the price data. This means the center line is more responsive to the overall direction of the trend and less influenced by isolated, erratic price spikes.
2. Volatility Banding (Dynamic Range) Surrounding the central LSMA line are two outer bands—an upper and a lower boundary. These are not fixed distances; rather, they expand and contract based on market volatility. The script calculates how much the actual price deviates from the central LSMA line over a specific timeframe.
3. Deviation Scaling The width of these bands is determined by a "Deviation" setting. This allows the indicator to measure the standard distance that price typically travels away from its average.
- When the market is calm and stable, the bands tighten together.
- During periods of high activity or aggressive price swings, the bands widen significantly to account for the increased movement.
How the Logic Works Together
The script constantly scans the historical closing prices to calculate the central "path" (LSMA). Simultaneously, it measures the variance (the "spread") between those prices and that path. By projecting these results onto your chart, the indicator creates a visual channel:
- The Center Line: Shows you the core trend of the current market cycle.
- The Upper and Lower Bands: Define the "normal" boundaries of price action.
By observing where the price sits in relation to these bands and the central line, traders can better visualize whether the current market movement is remaining within expected parameters or if it is stretching toward an extreme point.
//+------------------------------------------------------------------+
//|                                                    BandsLSMA.mq4 |
//|                      Copyright © 2005, MetaQuotes Software Corp. |
//|                                       http://www.metaquotes.net/ |
//+------------------------------------------------------------------+
#property copyright "Copyright © 2005, MetaQuotes Software Corp."
#property link      "http://www.metaquotes.net/"

#property indicator_chart_window
#property indicator_buffers 3
#property indicator_color1 DodgerBlue
#property indicator_color2 Blue
#property indicator_color3 Blue
//---- indicator parameters
extern int    BandsPeriod = 20;
extern int    BandsShift = 0;
extern double BandsDeviations = 2.0;
//---- buffers
double MovingBuffer[];
double UpperBuffer[];
double LowerBuffer[];
//+------------------------------------------------------------------+
//| Custom indicator initialization function                         |
//+------------------------------------------------------------------+
int init()
  {
//---- indicators
   SetIndexStyle(0, DRAW_LINE);
   SetIndexBuffer(0, MovingBuffer);
   SetIndexStyle(1, DRAW_LINE);
   SetIndexBuffer(1, UpperBuffer);
   SetIndexStyle(2, DRAW_LINE);
   SetIndexBuffer(2, LowerBuffer);
//----
   SetIndexDrawBegin(0, BandsPeriod+BandsShift);
   SetIndexDrawBegin(1, BandsPeriod+BandsShift);
   SetIndexDrawBegin(2, BandsPeriod+BandsShift);
//----
   return(0);
  }
//+------------------------------------------------------------------------+
//| LSMA - Least Squares Moving Average function calculation               |
//| LSMA_In_Color Indicator plots the end of the linear regression line    |
//+------------------------------------------------------------------------+
double LSMA(int Rperiod, int shift)
  {
   int i;
   double sum;
   int length;
   double lengthvar;
   double tmp;
   double wt;
//----
   length = Rperiod;
   sum = 0;
   for(i = length; i >= 1  ; i--)
     {
       lengthvar = length + 1;
       lengthvar /= 3;
       tmp = 0;
       tmp = ( i - lengthvar)*Close[length-i+shift];
       sum += tmp;
     }
    wt = sum*6 / (length*(length + 1));
//----
    return(wt);
  }
//+------------------------------------------------------------------+
//| Bollinger Bands                                                  |
//+------------------------------------------------------------------+
int start()
  {
   int    i, k, counted_bars = IndicatorCounted();
   double deviation;
   double sum, oldval, newres;
//----
   if(Bars <= BandsPeriod)
       return(0);
//---- initial zero
   if(counted_bars < 1)
       for(i = 1; i <= BandsPeriod; i++)
         {
           MovingBuffer[Bars-i] = EMPTY_VALUE;
           UpperBuffer[Bars-i] = EMPTY_VALUE;
           LowerBuffer[Bars-i] = EMPTY_VALUE;
         }
//----
   int limit = Bars - counted_bars;
   if(counted_bars > 0)
       limit++;
   for(i = 0; i < limit; i++)
       MovingBuffer[i] = LSMA(BandsPeriod, i);
//----
   i = Bars - BandsPeriod + 1;
   if(counted_bars > BandsPeriod - 1)
       i = Bars - counted_bars - 1;
   while(i >= 0)
     {
       sum = 0.0;
       k = i + BandsPeriod - 1;
       oldval = MovingBuffer[i];
       while(k >= i)
         {
           newres = Close[k] - oldval;
           sum += newres*newres;
           k--;
         }
       deviation = BandsDeviations*MathSqrt(sum / BandsPeriod);
       UpperBuffer[i] = oldval + deviation;
       LowerBuffer[i] = oldval - deviation;
       i--;
     }
//----
   return(0);
  }
//+------------------------------------------------------------------+
Comments