Awesome_001
Download script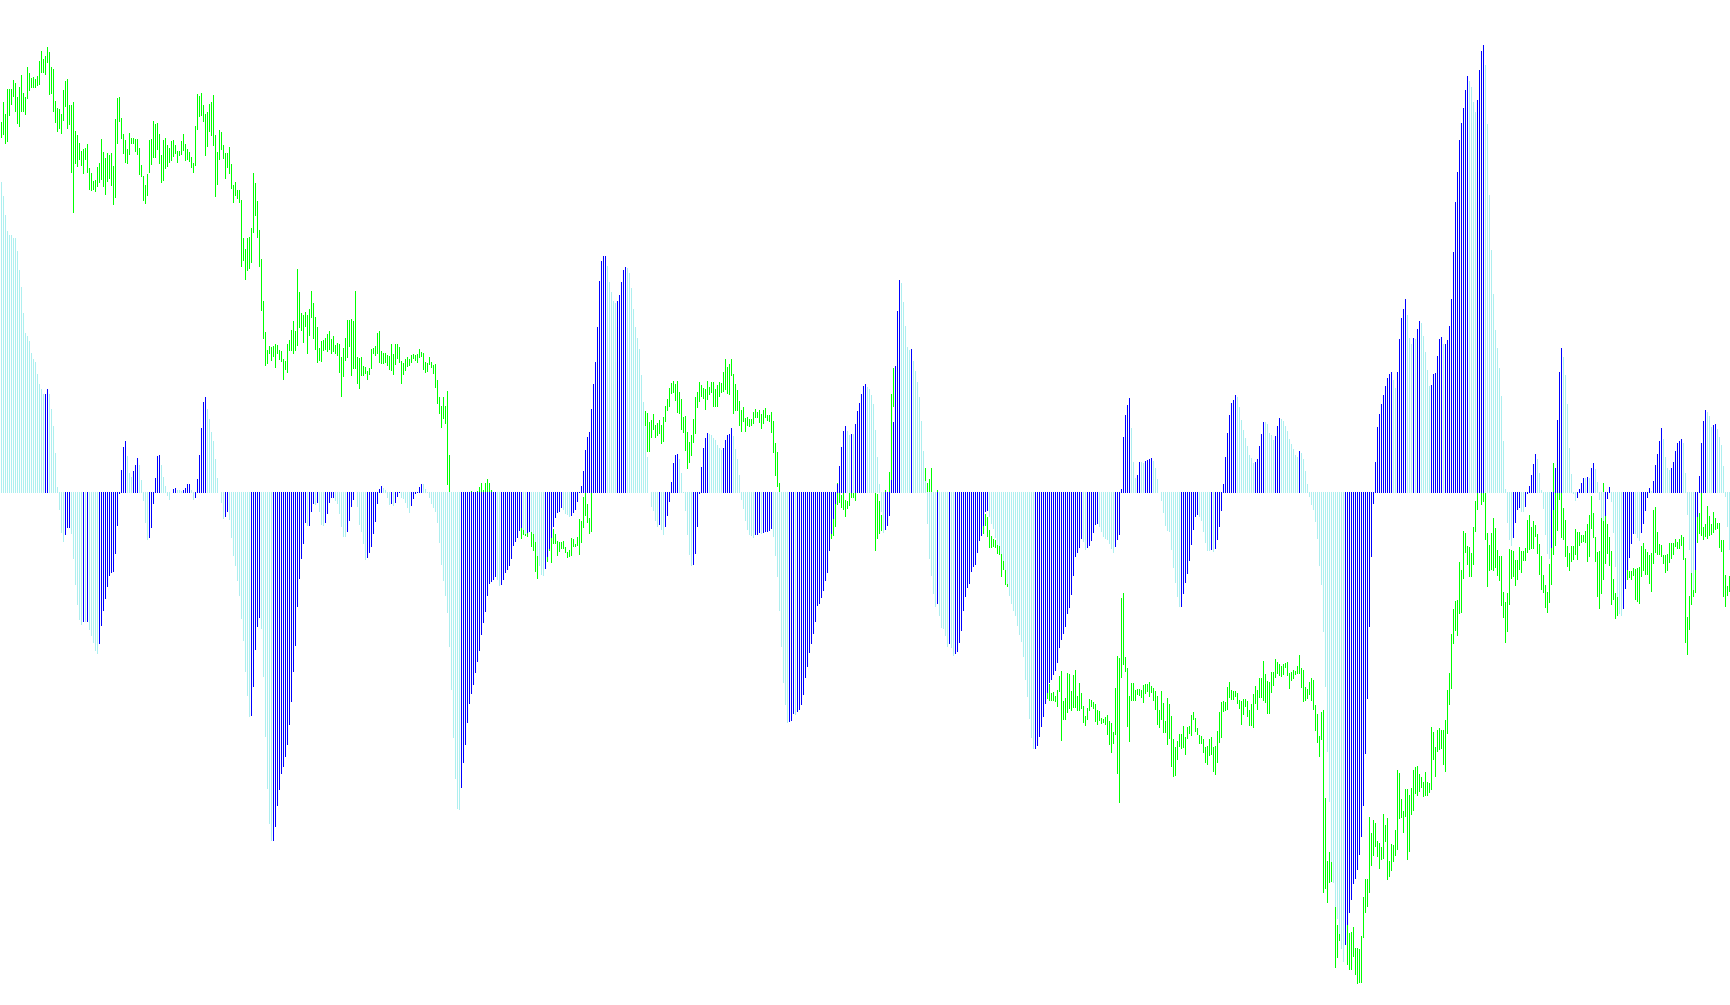
This script is designed to function as a visual momentum indicator for trading charts. It provides traders with a clear picture of the market's underlying strength and direction by identifying "momentum shifts"—those moments where the speed of price movement changes from upward to downward, or vice versa.
Core Mechanics
The logic operates in two distinct phases to translate raw market data into a readable visual format:
1. Calculating Market Momentum The script begins by analyzing the price history using two different Simple Moving Averages (SMAs). One average covers a short-term period (5 bars) and the other covers a significantly longer period (34 bars). By subtracting the long-term value from the short-term value, the script calculates a "momentum score."
- When the short-term momentum is higher than the long-term, it indicates positive strength.
- When the short-term momentum drops below the long-term, it signals a decline in strength.
2. Visualizing the Trend (Color Logic) To make this data easy for a human to interpret at a glance, the script processes these scores into a histogram format:
- Trend Tracking: The tool compares the current momentum score with the previous one to determine if the market is currently gaining or losing energy.
- Dynamic Coloring: If the momentum is increasing, the script renders the data in a specific color (Green). If the momentum begins to decrease, it switches the visual representation to a different color (Red).
- Zero-Baseline Clarity: The script ensures that the histogram clearly distinguishes between positive and negative territory, providing a clean "mountain and valley" look that allows traders to see where the trend is strongest and where it might be tiring out.
Summary for Traders
Essentially, this tool acts as a momentum filter. Instead of just looking at the price, it shows you the "velocity" behind the movement. It highlights whether the current market push is still gaining steam or if it has started to lose its power, helping traders identify potential turning points in the trend.
//+------------------------------------------------------------------+
//|                                                      Awesome.mq4 |
//|                      Copyright © 2005, MetaQuotes Software Corp. |
//|                                       http://www.metaquotes.net/ |
//+------------------------------------------------------------------+
#property  copyright "Copyright © 2005, MetaQuotes Software Corp."
#property  link      "http://www.metaquotes.net/"
//---- indicator settings
#property  indicator_separate_window
#property  indicator_buffers 3
#property  indicator_color1  Black
#property  indicator_color2  Green
#property  indicator_color3  Red

//---- indicator buffers
double     ExtBuffer0[];
double     ExtBuffer1[];
double     ExtBuffer2[];

//+------------------------------------------------------------------+
//| Custom indicator initialization function                         |
//+------------------------------------------------------------------+
int init()
  {
   //---- drawing settings
   SetIndexStyle(0,DRAW_NONE);
   SetIndexStyle(1,DRAW_HISTOGRAM);
   SetIndexStyle(2,DRAW_HISTOGRAM);
   IndicatorDigits(Digits+1);
   SetIndexDrawBegin(0,34);
   SetIndexDrawBegin(1,34);
   SetIndexDrawBegin(2,34);
//---- 3 indicator buffers mapping
   SetIndexBuffer(0,ExtBuffer0);
   SetIndexBuffer(1,ExtBuffer1);
   SetIndexBuffer(2,ExtBuffer2);
//---- name for DataWindow and indicator subwindow label
   IndicatorShortName("AO");
   SetIndexLabel(1,NULL);
   SetIndexLabel(2,NULL);
//---- initialization done
   return(0);
  }
//+------------------------------------------------------------------+
//| Awesome Oscillator                                               |
//+------------------------------------------------------------------+
int start()
  {
   int    limit;
   int    counted_bars=IndicatorCounted();
   double prev,current;
//---- last counted bar will be recounted
   if(counted_bars>0) counted_bars--;
   limit=Bars-counted_bars;
//---- macd
   for(int i=0; i<limit; i++)
      ExtBuffer0[i]=iMA(NULL,0,5,0,MODE_SMA,PRICE_MEDIAN,i)-iMA(NULL,0,34,0,MODE_SMA,PRICE_MEDIAN,i);
//---- dispatch values between 2 buffers
   bool up=true;
   for(i=limit-1; i>=0; i--)
     {
      current=ExtBuffer0[i];
      prev=ExtBuffer0[i+1];
      if(current>prev) up=true;
      if(current<prev) up=false;
      if(!up)
        {
         ExtBuffer2[i]=current;
         ExtBuffer1[i]=0.0;
        }
      else
        {
         ExtBuffer1[i]=current;
         ExtBuffer2[i]=0.0;
        }
     }
//---- done
   return(0);
  }
//+------------------------------------------------------------------+
Comments