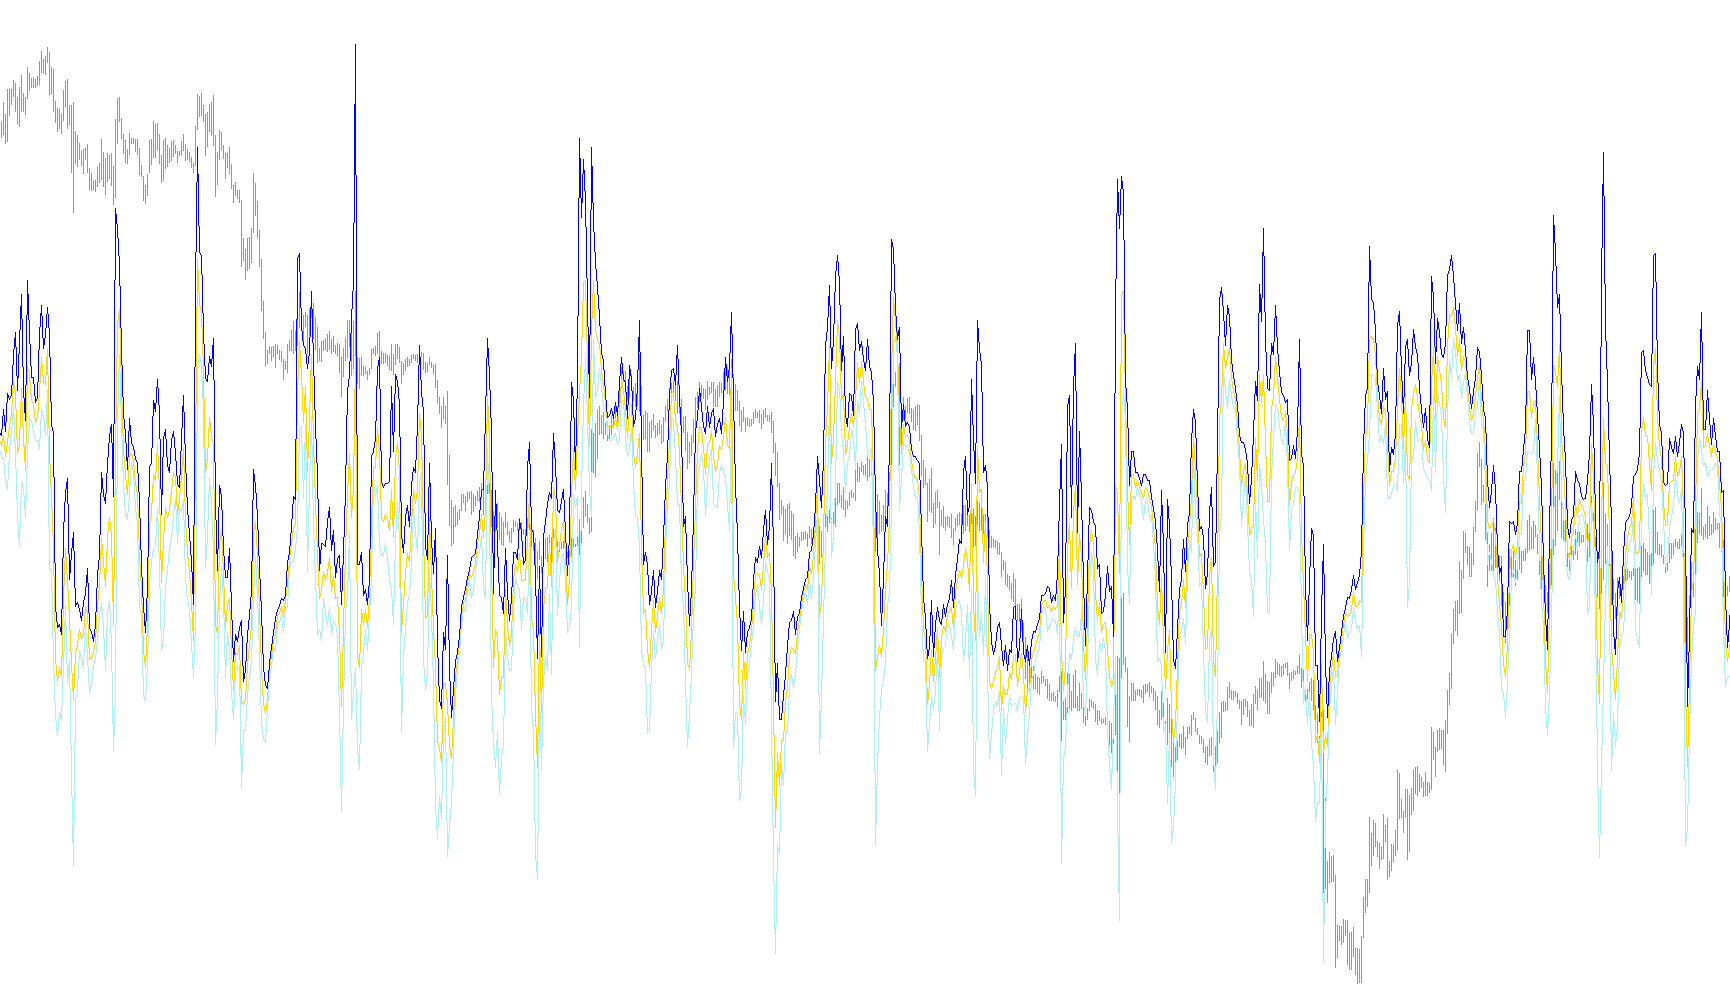
The "Ball" indicator is a specialized technical analysis tool designed to visualize price positioning and volatility relative to a moving average. Rather than simply showing standard price lines, it calculates the relationship between current market prices and a dynamic range to create a custom visual output in a separate window.
Core Logic Overview
1. Foundation: Moving Average Calculation The script begins by establishing a baseline using a Moving Average (MA). It allows for various types of averages (such as Simple, Exponential, Smoothed, or Linear Weighted) and can be applied to different price points (like the closing price, opening price, or high/low extremes). This serves as the "anchor" for all subsequent calculations.
2. Volatility and Range Analysis The tool utilizes the logic of Bollinger Bands to determine market volatility. It calculates a standard deviation—which measures how much the price fluctuates away from the moving average over a specific period. By combining this deviation with the moving average, the script establishes an "Upper" and "Lower" boundary. These boundaries represent the expected range of price movement based on recent history.
3. Relative Positioning (The "Ball" Logic) This is where the script differs from standard indicators. Instead of plotting the actual price or the raw band values, it calculates the relative position of the current candle's High and Low prices within that volatility range:
- Lower Position: It measures how far the current Low price sits relative to the lower boundary.
- Upper Position: It measures how far the current High price sits relative to the upper boundary.
4. Final Output Generation The script converts these spatial measurements into a normalized numerical scale (percentage-based). It then calculates:
- A Lower Value: Representing the downward momentum/position.
- An Upper Value: Representing the upward momentum/position.
- A Middle Value: The mathematical average of the upper and lower positions.
User Experience Summary
In practical terms, the indicator creates a visual "oscillation" in a separate window. By monitoring these values, a trader can see where the price is currently situated relative to its recent volatility boundaries. It effectively "normalizes" the price action, making it easier to identify whether the market is stretching toward extremes or staying centered within its current range.
//+------------------------------------------------------------------+
//|                                                        Ball.mq4  |
//|                                                                  |
//+------------------------------------------------------------------+
#property copyright "created by Art "
#property link      "shaddow@yandex.ru"

#property indicator_separate_window
#property indicator_buffers 3
#property indicator_color1 Gray
#property indicator_color2 Lime
#property indicator_color3 Red


#property indicator_level1  100
#property indicator_level2 -100
#property indicator_level3  0

#property indicator_minimum -185
#property indicator_maximum  185


//---- indicator parameters
extern int    BandsPeriod=20;
extern double BandsDeviations=2.0;
extern int    ModeMA=0;
//MODE_SMA 0 Ïðîñòîå ñêîëüçÿùåå ñðåäíåå
//MODE_EMA 1 Ýêñïîíåíöèàëüíîå ñêîëüçÿùåå ñðåäíåå
//MODE_SMMA 2 Ñãëàæåííîå ñêîëüçÿùåå ñðåäíåå
//MODE_LWMA 3 Ëèíåéíî-âçâåøåííîå ñêîëüçÿùåå ñðåäíåå
extern int    ModePrice=0;
//PRICE_CLOSE 0 Öåíà çàêðûòèÿ
//PRICE_OPEN 1 Öåíà îòêðûòèÿ
//PRICE_HIGH 2 Ìàêñèìàëüíàÿ öåíà
//PRICE_LOW 3 Ìèíèìàëüíàÿ öåíà
//PRICE_MEDIAN 4 Ñðåäíÿÿ öåíà, (high+low)/2
//PRICE_TYPICAL 5 Òèïè÷íàÿ öåíà, (high+low+close)/3
//PRICE_WEIGHTED 6 Âçâåøåííàÿ öåíà çàêðûòèÿ, (high+low+close+close)/4

double ExtMapBufferUpper [];
double ExtMapBufferMiddle[];
double ExtMapBufferLower [];
int    BandsShift=0;

int    IndicatorLowZnach, IndicatorUpZnach, IndicatorHeightZnach;
double LowerBB, UpperBB, MiddleBB, PriceChannelHigh, PriceChannelLo, PriceChannel ;   // ïîëîñû Áîëëèíäæåðà


int init()
  {

   SetIndexStyle(0,0,0,1);
   SetIndexBuffer(0,ExtMapBufferMiddle);
   SetIndexLabel(0,"Ñðåäíÿÿ");

   SetIndexStyle(1,0,0,1);
   SetIndexBuffer(1,ExtMapBufferUpper);
   SetIndexLabel(1,"Âåðõíÿÿ");

   SetIndexStyle(2,0,0,1);
   SetIndexBuffer(2,ExtMapBufferLower);
   SetIndexLabel(2,"Íèæíÿÿ");


//----
   SetIndexDrawBegin(0,BandsPeriod+BandsShift);
   SetIndexDrawBegin(1,BandsPeriod+BandsShift);
   SetIndexDrawBegin(2,BandsPeriod+BandsShift);

   IndicatorShortName("Ball");


  string StrMA,StrModePrice;

//MODE_SMA 0 Ïðîñòîå ñêîëüçÿùåå ñðåäíåå
//MODE_EMA 1 Ýêñïîíåíöèàëüíîå ñêîëüçÿùåå ñðåäíåå
//MODE_SMMA 2 Ñãëàæåííîå ñêîëüçÿùåå ñðåäíåå
//MODE_LWMA 3 Ëèíåéíî-âçâåøåííîå ñêîëüçÿùåå ñðåäíåå

//PRICE_CLOSE 0 Öåíà çàêðûòèÿ
//PRICE_OPEN 1 Öåíà îòêðûòèÿ
//PRICE_HIGH 2 Ìàêñèìàëüíàÿ öåíà
//PRICE_LOW 3 Ìèíèìàëüíàÿ öåíà
//PRICE_MEDIAN 4 Ñðåäíÿÿ öåíà, (high+low)/2
//PRICE_TYPICAL 5 Òèïè÷íàÿ öåíà, (high+low+close)/3
//PRICE_WEIGHTED 6 Âçâåøåííàÿ öåíà çàêðûòèÿ, (high+low+close+close)/4


  StrMA="";
  StrModePrice="";

  if (ModeMA==0) StrMA ="Ïðîñòîå ñêîëüçÿùåå ñðåäíåå";
  if (ModeMA==1) StrMA ="Ýêñïîíåíöèàëüíîå ñêîëüçÿùåå ñðåäíåå";
  if (ModeMA==2) StrMA ="Ñãëàæåííîå ñêîëüçÿùåå ñðåäíåå";
  if (ModeMA==3) StrMA ="Ëèíåéíî-âçâåøåííîå ñêîëüçÿùåå ñðåäíåå";
  if ((ModeMA>3) || (ModeMA<0))
  {
  StrMA ="Ïðîñòîå ñêîëüçÿùåå ñðåäíåå";
  ModeMA=0;
  }

  if (ModePrice==0) StrModePrice ="Öåíà çàêðûòèÿ";
  if (ModePrice==1) StrModePrice ="Öåíà îòêðûòèÿ";
  if (ModePrice==2) StrModePrice ="Ìàêñèìàëüíàÿ öåíà";
  if (ModePrice==3) StrModePrice ="Ìèíèìàëüíàÿ öåíà";
  if (ModePrice==4) StrModePrice ="Ñðåäíÿÿ öåíà";
  if (ModePrice==5) StrModePrice ="Òèïè÷íàÿ öåíà";
  if (ModePrice==6) StrModePrice ="Âçâåøåííàÿ öåíà çàêðûòèÿ";
  if ((ModePrice>6) || (ModePrice<0))
  {
  StrModePrice ="Öåíà çàêðûòèÿ";
  ModePrice=0;
  }

  Comment("Ìåòîä âû÷èñëåíèÿ MA ",StrMA,"\n","Èñïîëüçóåìàÿ öåíà äëÿ ðàñ÷¸òà ",StrModePrice);


//----
   return(0);
  }
//+------------------------------------------------------------------+
//| Bollinger Bands                                                  |
//+------------------------------------------------------------------+
int start()
  {

   int    i,k,counted_bars=IndicatorCounted();
   double deviation;
   double sum,oldval,newres;
   double tempValMid;
//----
   if(Bars<=BandsPeriod) return(0);
//----
   int limit=Bars-counted_bars;
   if(counted_bars>0) limit++;
   for(i=0; i<limit; i++)
   tempValMid=iMA(NULL,0,BandsPeriod,BandsShift,ModeMA,ModePrice,i);
//----
   i=Bars-BandsPeriod+1;
   if(counted_bars>BandsPeriod-1) i=Bars-counted_bars-1;
   while(i>=0)
     {
      sum=0.0;
      k=i+BandsPeriod-1;
      tempValMid=iMA(NULL,0,BandsPeriod,BandsShift,ModeMA,ModePrice,i);
      oldval=tempValMid;

      while(k>=i)
        {
         newres=Close[k]-oldval;
         sum+=newres*newres;
         k--;
        }
      deviation=BandsDeviations*MathSqrt(sum/BandsPeriod);

      ExtMapBufferMiddle[i]=tempValMid;
      UpperBB= oldval+deviation;
      MiddleBB=ExtMapBufferMiddle[i];
      LowerBB= oldval-deviation;


      double myPriceH=High[i];
      double myPriceL=Low[i];

      IndicatorLowZnach=-1*(NormalizeDouble(((MiddleBB-myPriceL)*100)/((MiddleBB-LowerBB)),0));
      IndicatorUpZnach=     NormalizeDouble(((myPriceH-MiddleBB)*100)/((UpperBB-MiddleBB)),0);


      ExtMapBufferUpper[i] =IndicatorUpZnach;
      ExtMapBufferMiddle[i]=(IndicatorUpZnach+IndicatorLowZnach)/2;
      ExtMapBufferLower[i] =IndicatorLowZnach;

      i--;
     }
//----
   return(0);
  }
//+------------------------------------------------------------------+
Comments