Bands_v3
Download script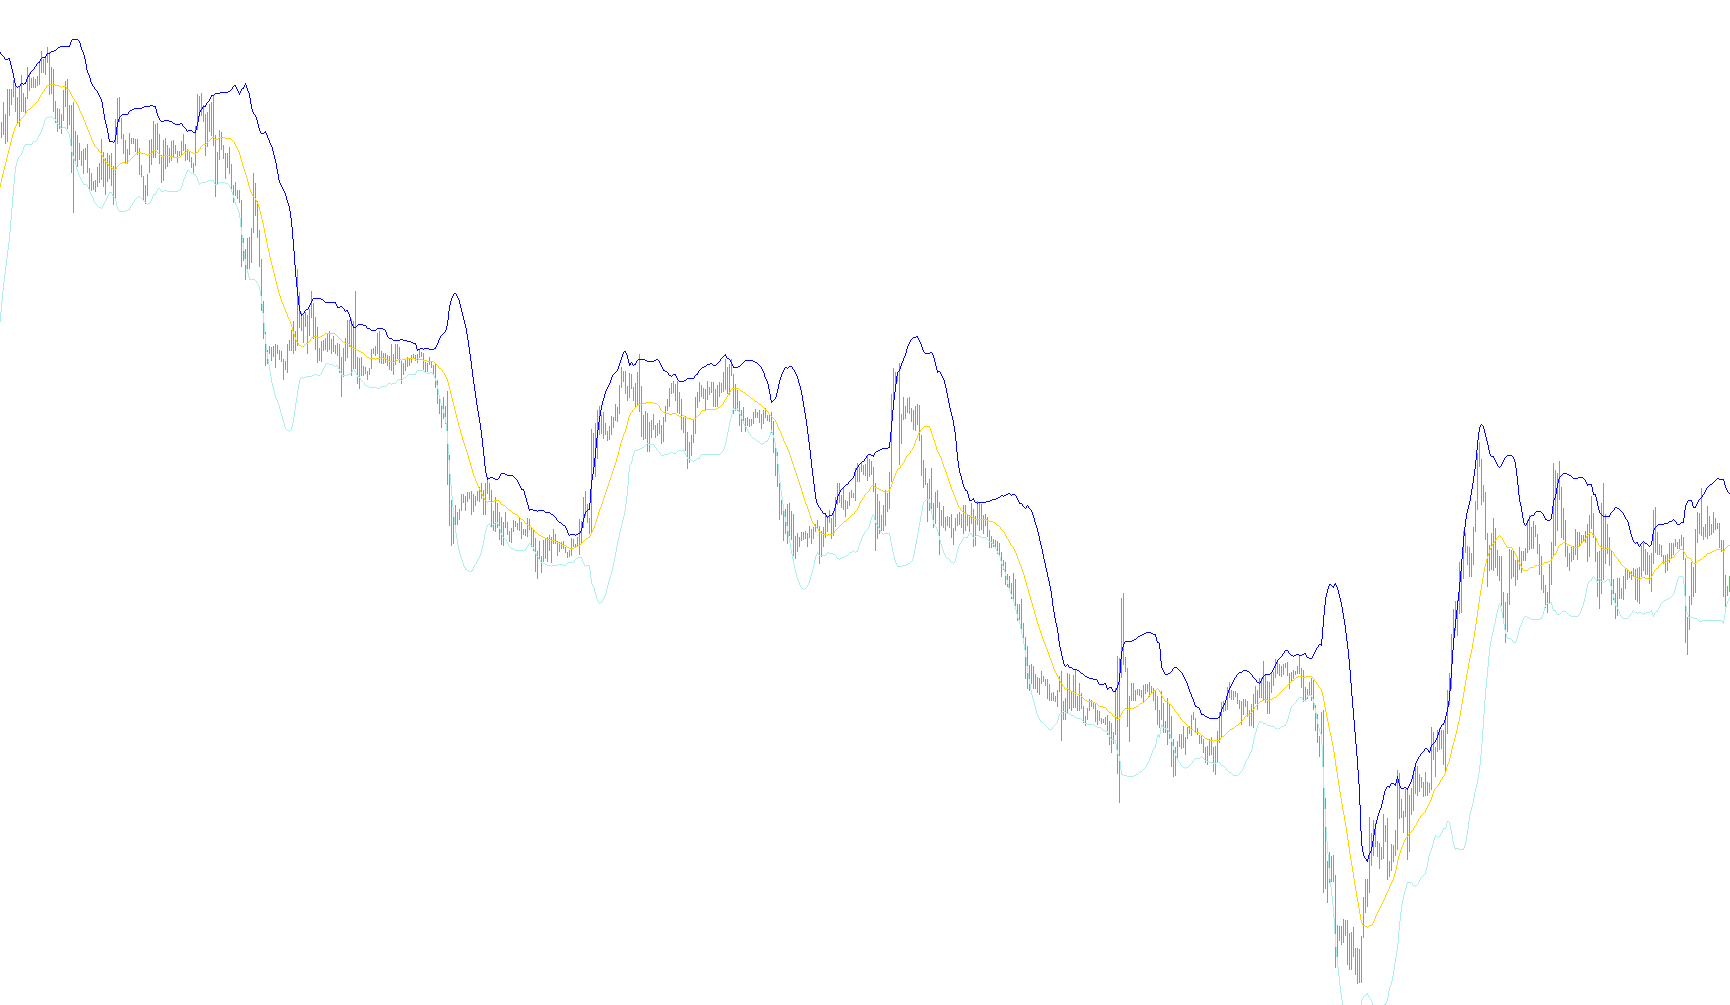
This script is designed to function as a technical analysis tool, specifically creating a visual aid known as Bollinger Bands on your trading charts. Its primary purpose is to help traders identify the "normal" range of price action and spot potential opportunities when the market moves outside of those expected boundaries.
The logic follows a three-step process:
1. Establishing the Baseline (Moving Average) The script first calculates a "Moving Average" of the asset's closing prices over a specific number of previous bars (which can be adjusted by the user). This acts as the center line of the indicator. It smooths out the "noise" of short-term price fluctuations to show you the overall trend of the market at that moment.
2. Measuring Market Volatility (Standard Deviation) Once the center line is established, the script looks backward at the price history to see how much the price typically swings away from that average. It calculates the "Standard Deviation," which is a mathematical way of measuring volatility. If the market is calm, these swings are small; if the market is turbulent, these swings are large.
3. Plotting the Boundary Lines (Upper and Lower Bands) Finally, the script uses that volatility measurement to draw two outer lines:
- The Upper Band: This is calculated by taking the center average and adding a specific multiplier of the volatility.
- The Lower Band: This is calculated by taking the center average and subtracting that same multiplier.
How to interpret this visually: When you see these three lines on your chart, they create a "channel." The logic assumes that, most of the time, the price will stay within these two outer boundaries. When the price pushes toward or pierces through these bands, it indicates that the market is experiencing significant movement relative to its recent history, often signaling that the asset may be overextended in one direction or about to undergo a trend change.
/*-----------------------------+
|			       |
| Shared by www.Aptrafx.com    |
|			       |
+------------------------------*/

//+------------------------------------------------------------------+
//|                                                        Bands.mq4 |
//|                      Copyright © 2005, MetaQuotes Software Corp. |
//|                                       http://www.metaquotes.net/ |
//+------------------------------------------------------------------+
#property copyright "Copyright © 2005, MetaQuotes Software Corp."
#property link      "http://www.metaquotes.net/"

#property indicator_chart_window
#property indicator_buffers 3
#property indicator_color1 LightSeaGreen
#property indicator_color2 LightSeaGreen
#property indicator_color3 LightSeaGreen
//---- indicator parameters
extern int    BandsPeriod=20;
extern int    BandsShift=0;
extern double BandsDeviations=2.0;
//---- buffers
double MovingBuffer[];
double UpperBuffer[];
double LowerBuffer[];
//+------------------------------------------------------------------+
//| Custom indicator initialization function                         |
//+------------------------------------------------------------------+
int init()
  {
//---- indicators
   SetIndexStyle(0,DRAW_LINE);
   SetIndexBuffer(0,MovingBuffer);
   SetIndexStyle(1,DRAW_LINE);
   SetIndexBuffer(1,UpperBuffer);
   SetIndexStyle(2,DRAW_LINE);
   SetIndexBuffer(2,LowerBuffer);
//----
   SetIndexDrawBegin(0,BandsPeriod+BandsShift);
   SetIndexDrawBegin(1,BandsPeriod+BandsShift);
   SetIndexDrawBegin(2,BandsPeriod+BandsShift);
//----
   return(0);
  }
//+------------------------------------------------------------------+
//| Bollinger Bands                                                  |
//+------------------------------------------------------------------+
int start()
  {
   int    i,k,counted_bars=IndicatorCounted();
   double deviation;
   double sum,oldval,newres;
//----
   if(Bars<=BandsPeriod) return(0);
//---- initial zero
   if(counted_bars<1)
      for(i=1;i<=BandsPeriod;i++)
        {
         MovingBuffer[Bars-i]=EMPTY_VALUE;
         UpperBuffer[Bars-i]=EMPTY_VALUE;
         LowerBuffer[Bars-i]=EMPTY_VALUE;
        }
//----
   int limit=Bars-counted_bars;
   if(counted_bars>0) limit++;
   for(i=0; i<limit; i++)
      MovingBuffer[i]=iMA(NULL,0,BandsPeriod,BandsShift,MODE_SMA,PRICE_CLOSE,i);
//----
   i=Bars-BandsPeriod+1;
   if(counted_bars>BandsPeriod-1) i=Bars-counted_bars-1;
   while(i>=0)
     {
      sum=0.0;
      k=i+BandsPeriod-1;
      oldval=MovingBuffer[i];
      while(k>=i)
        {
         newres=Close[k]-oldval;
         sum+=newres*newres;
         k--;
        }
      deviation=BandsDeviations*MathSqrt(sum/BandsPeriod);
      UpperBuffer[i]=oldval+deviation;
      LowerBuffer[i]=oldval-deviation;
      i--;
     }
//----
   return(0);
  }
//+------------------------------------------------------------------+
Comments