Bands_001
Download script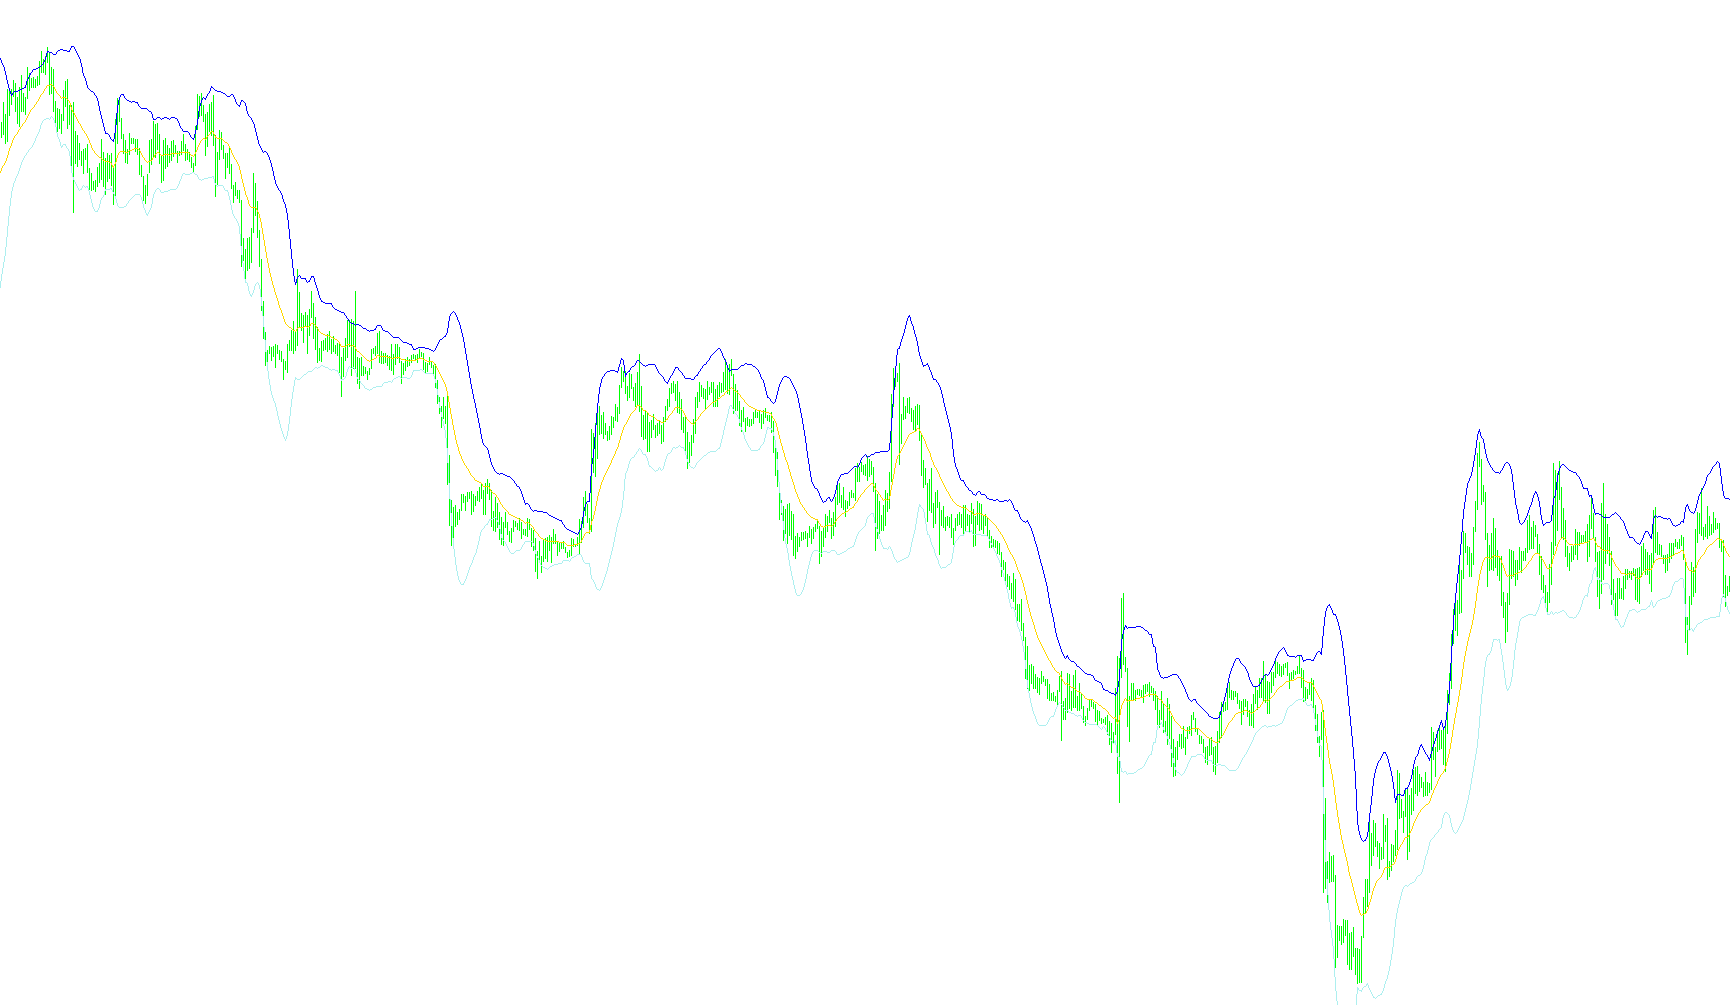
This tool is designed to provide a visual representation of market volatility and price trends on your trading charts. It calculates a specific set of boundaries—known as Bollinger Bands—which help traders identify whether the current market price is behaving normally or if it is moving into "overextended" territory.
How the Logic Works
The script functions by processing historical price data to generate three distinct lines on your chart:
1. The Moving Average (The Center Line) At its core, the tool calculates a "Moving Average." This is a smoothed line that represents the average price over a specific period of time (which you can customize). Instead of looking at every tiny fluctuation, this line helps filter out the "noise" to show you the general direction in which the market is heading.
2. The Deviation Calculation (The Volatility Factor) The script doesn't just draw lines based on a fixed distance; it measures how much the price typically swings away from the center line. It looks at the "Standard Deviation"—essentially a mathematical measurement of how erratic or calm the market has been lately. If the market is swinging wildly, the bands will widen; if the market is stable and moving slowly, the bands will contract.
3. The Upper and Lower Bands By taking that volatility measurement and multiplying it by a specific "Deviation" factor (which you set in the settings), the script creates two outer boundaries:
- The Upper Band: Represents the price ceiling based on current market volatility.
- The Lower Band: Represents the price floor based on current market volatility.
Summary of Behavior
When you apply this to a chart, you see a "channel" that moves with the price. The logic is designed so that:
- When the price stays inside the bands, it is generally considered to be trading within its normal expected range.
- When the price touches or breaks out of the upper or lower bands, it signals that the market is experiencing a significant move relative to its recent history, which many traders use as a signal for potential price exhaustion or trend reversals.
By allowing you to adjust the "Period" (how much history to look at) and the "MA Method" (how the average is calculated), the tool provides a flexible way to tailor these boundaries to different types of assets or trading styles.
//+------------------------------------------------------------------+
//|                                                        Bands.mq4 |
//|                   Copyright © 2005-07, MetaQuotes Software Corp. |
//|                                       http://www.metaquotes.net/ |
//+------------------------------------------------------------------+
#property copyright "Copyright © 2005-07, MetaQuotes Software Corp."
#property link      "http://www.metaquotes.net/"

#property indicator_chart_window
#property indicator_buffers 3
#property indicator_color1 Red
#property indicator_color2 DarkGray
#property indicator_color3 DimGray
//---- indicator parameters
extern int    BandsPeriod=18;
extern int    BandsShift=0;
extern double BandsDeviations=2.0;
extern string note1 = "0=SimpleMA, 1=EMA";
extern string note2 = "2=SmoothMA, 3=LWMA";
extern int MA_Method=1;
//---- buffers
double MovingBuffer[];
double UpperBuffer[];
double LowerBuffer[];
//+------------------------------------------------------------------+
//| Custom indicator initialization function                         |
//+------------------------------------------------------------------+
int init()
  {
//---- indicators
   SetIndexStyle(0,DRAW_LINE);
   SetIndexBuffer(0,MovingBuffer);
   SetIndexStyle(1,DRAW_LINE);
   SetIndexBuffer(1,UpperBuffer);
   SetIndexStyle(2,DRAW_LINE);
   SetIndexBuffer(2,LowerBuffer);
//----
   SetIndexDrawBegin(0,BandsPeriod+BandsShift);
   SetIndexDrawBegin(1,BandsPeriod+BandsShift);
   SetIndexDrawBegin(2,BandsPeriod+BandsShift);
//----
   return(0);
  }
//+------------------------------------------------------------------+
//| Bollinger Bands                                                  |
//+------------------------------------------------------------------+
int start()
  {
   int    i,k,counted_bars=IndicatorCounted();
   double deviation;
   double sum,oldval,newres;
//----
   if(Bars<=BandsPeriod) return(0);
//---- initial zero
   if(counted_bars<1)
      for(i=1;i<=BandsPeriod;i++)
        {
         MovingBuffer[Bars-i]=EMPTY_VALUE;
         UpperBuffer[Bars-i]=EMPTY_VALUE;
         LowerBuffer[Bars-i]=EMPTY_VALUE;
        }
//----
   int limit=Bars-counted_bars;
   if(counted_bars>0) limit++;
   for(i=0; i<limit; i++)
//      MovingBuffer[i]=iMA(NULL,0,BandsPeriod,BandsShift,MODE_SMA,PRICE_CLOSE,i);
      MovingBuffer[i]=iMA(NULL,0,BandsPeriod,BandsShift,MA_Method,PRICE_CLOSE,i);
//----
   i=Bars-BandsPeriod+1;
   if(counted_bars>BandsPeriod-1) i=Bars-counted_bars-1;
   while(i>=0)
     {
      sum=0.0;
      k=i+BandsPeriod-1;
      oldval=MovingBuffer[i];
      while(k>=i)
        {
         newres=Close[k]-oldval;
         sum+=newres*newres;
         k--;
        }
      deviation=BandsDeviations*MathSqrt(sum/BandsPeriod);
      UpperBuffer[i]=oldval+deviation;
      LowerBuffer[i]=oldval-deviation;
      i--;
     }
//----
   return(0);
  }
//+------------------------------------------------------------------+
Comments