WPRSI_signal
Download script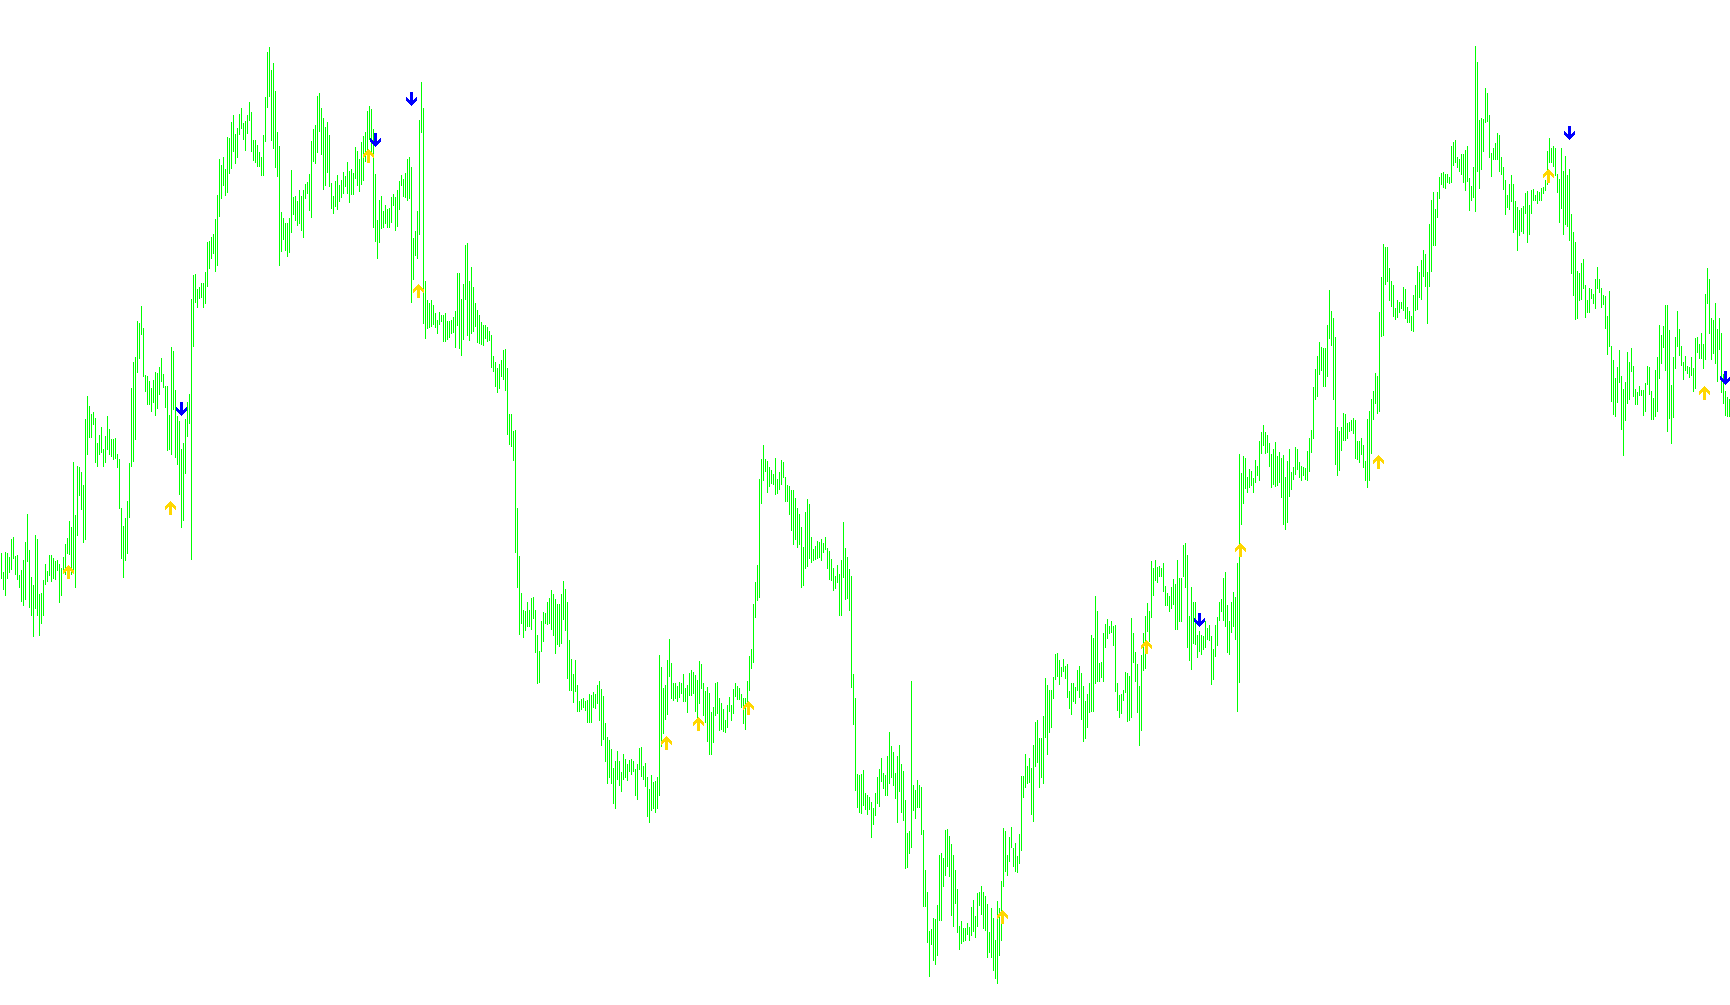
This script is a technical analysis tool designed to identify specific momentum shifts in the market by combining two different types of price oscillators: the Williams Percent Range (WPR) and the Relative Strength Index (RSI). Instead of just showing lines, it generates visual signals (arrows) on your chart to help highlight potential entry or exit points.
Core Logic Overview
The script works by looking for "crossover" events—moments where a price indicator moves from one extreme zone to another in a very short period. To ensure these signals are reliable and not just random noise, the script requires three distinct conditions to be met simultaneously before it places a signal on the chart.
How the Signals Are Generated
1. Bullish Signal Logic (Upward Movement) The tool looks for a specific "rebound" profile. It triggers a signal when:
- Momentum Shift: The Williams Percent Range indicator moves from below -20 to above -20.
- Strength Confirmation: Simultaneously, the RSI indicator must be trading above the 50 level (indicating bullish momentum).
- Verification Filter: To prevent "fake-outs," the script performs a secondary check on previous bars. It ensures that the price hasn't been hovering near that -20 level consistently; it looks for a clean break to confirm the move is meaningful.
- Visual Output: When all these conditions are met, a signal is placed at the midpoint of the candle's low range.
2. Bearish Signal Logic (Downward Movement) Conversely, the tool looks for a "breakdown" profile. It triggers a signal when:
- Momentum Shift: The Williams Percent Range indicator moves from above -80 to below -80.
- Strength Confirmation: Simultaneously, the RSI indicator must be trading below the 50 level (indicating bearish momentum).
- Verification Filter: Similar to the bullish logic, it scans the preceding bars to ensure the price didn't linger at the -80 mark too long, confirming that the downward move is a distinct shift in trend.
- Visual Output: When these conditions are met, a signal is placed at the midpoint of the candle's high range.
Summary for the Trader
In plain terms, this script ignores general market noise and only alerts you when the market shows a decisive "snap" in momentum. It identifies moments where the price breaks out of extreme boundaries (the -20 and -80 levels) while receiving confirmation from a secondary strength gauge (the RSI). By filtering for these specific crossovers, the tool aims to highlight high-probability trend reversals or continuations directly on your trading screen.
//+------------------------------------------------------------------+
//|                                                   WPRSIsignal.mq4|
//|                      Copyright © 2004, MetaQuotes Software Corp. |
//|                                        http://www.metaquotes.net |
//+------------------------------------------------------------------+
#property copyright "Copyright © 2004, MetaQuotes Software Corp."
#property link "http://www.metaquotes.net"


#property indicator_chart_window
#property indicator_buffers 2
#property indicator_color1 DodgerBlue
#property indicator_color2 Red
//---- input parameters
extern int WPRSIperiod=27;
extern int filterUP     =10;
extern int filterDN     =10;
//---- buffers
double ExtMapBuffer1[];
double ExtMapBuffer2[];
//----


//+------------------------------------------------------------------+
//| Custom indicator initialization function                         |
//+------------------------------------------------------------------+
int init()
  {
//---- indicators
   SetIndexStyle(0, DRAW_ARROW, 0, 1);
   SetIndexArrow(0, 233);
   SetIndexBuffer(0, ExtMapBuffer1);
//----
   SetIndexStyle(1, DRAW_ARROW, 0, 1);
   SetIndexArrow(1, 234);
   SetIndexBuffer(1, ExtMapBuffer2);
//---- name for DataWindow and indicator subwindow label
   IndicatorShortName("WPRSI");
   SetIndexLabel(0, "wprsiUP" + WPRSIperiod + "");
   SetIndexLabel(1, "wprsiDN" + WPRSIperiod + "");
//----

   return(0);
  }
//+------------------------------------------------------------------+
//| Custor indicator deinitialization function                       |
//+------------------------------------------------------------------+
int deinit()
  {
//----
   return(0);
  }
//+------------------------------------------------------------------+
//| Custom indicator iteration function                              |
//+------------------------------------------------------------------+
int start()
  {
   int limit;
   int counted_bars=IndicatorCounted();
//---- check for possible errors
   if(counted_bars < 0)
      return(-1);
//---- last counted bar will be recounted
   if(counted_bars > 0)
      counted_bars--;
   limit=Bars - counted_bars;
//----
   for(int i=1; i < limit; i++)
     {

      //----
      if( (iWPR(NULL,0,WPRSIperiod,i)>-20)&&(iWPR(NULL,0,WPRSIperiod,i+1)<-20)&&(iRSI(NULL,0,WPRSIperiod,PRICE_MEDIAN,i)>50)           )
         {
         double z=0;
         for(int k=2;k<=filterUP+2;k++)
         {

         if(iWPR(NULL,0,WPRSIperiod,k+i)>-20){z=1;  }

         }

         if(z==0)
         {
         ExtMapBuffer1[i]=Low[i] - (High[i]-Low[i])/2;
         }

         }


      //----
      if( (iWPR(NULL,0,WPRSIperiod,i+1)>-80)&&(iWPR(NULL,0,WPRSIperiod,i)<-80)&&(iRSI(NULL,0,WPRSIperiod,PRICE_MEDIAN,i)<50)           )

{
         double h=0;
         for(int c=2;c<=filterDN+2;c++)
         {

         if(iWPR(NULL,0,WPRSIperiod,c+i)<-80){h=1;  }

         }

         if(h==0)
         {

         ExtMapBuffer2[i]=High[i] +(High[i]-Low[i])/2;
         }
}


     }
//----
   return(0);
  }
//+------------------------------------------------------------------+
Comments