WSOWROTrend_v1
Download script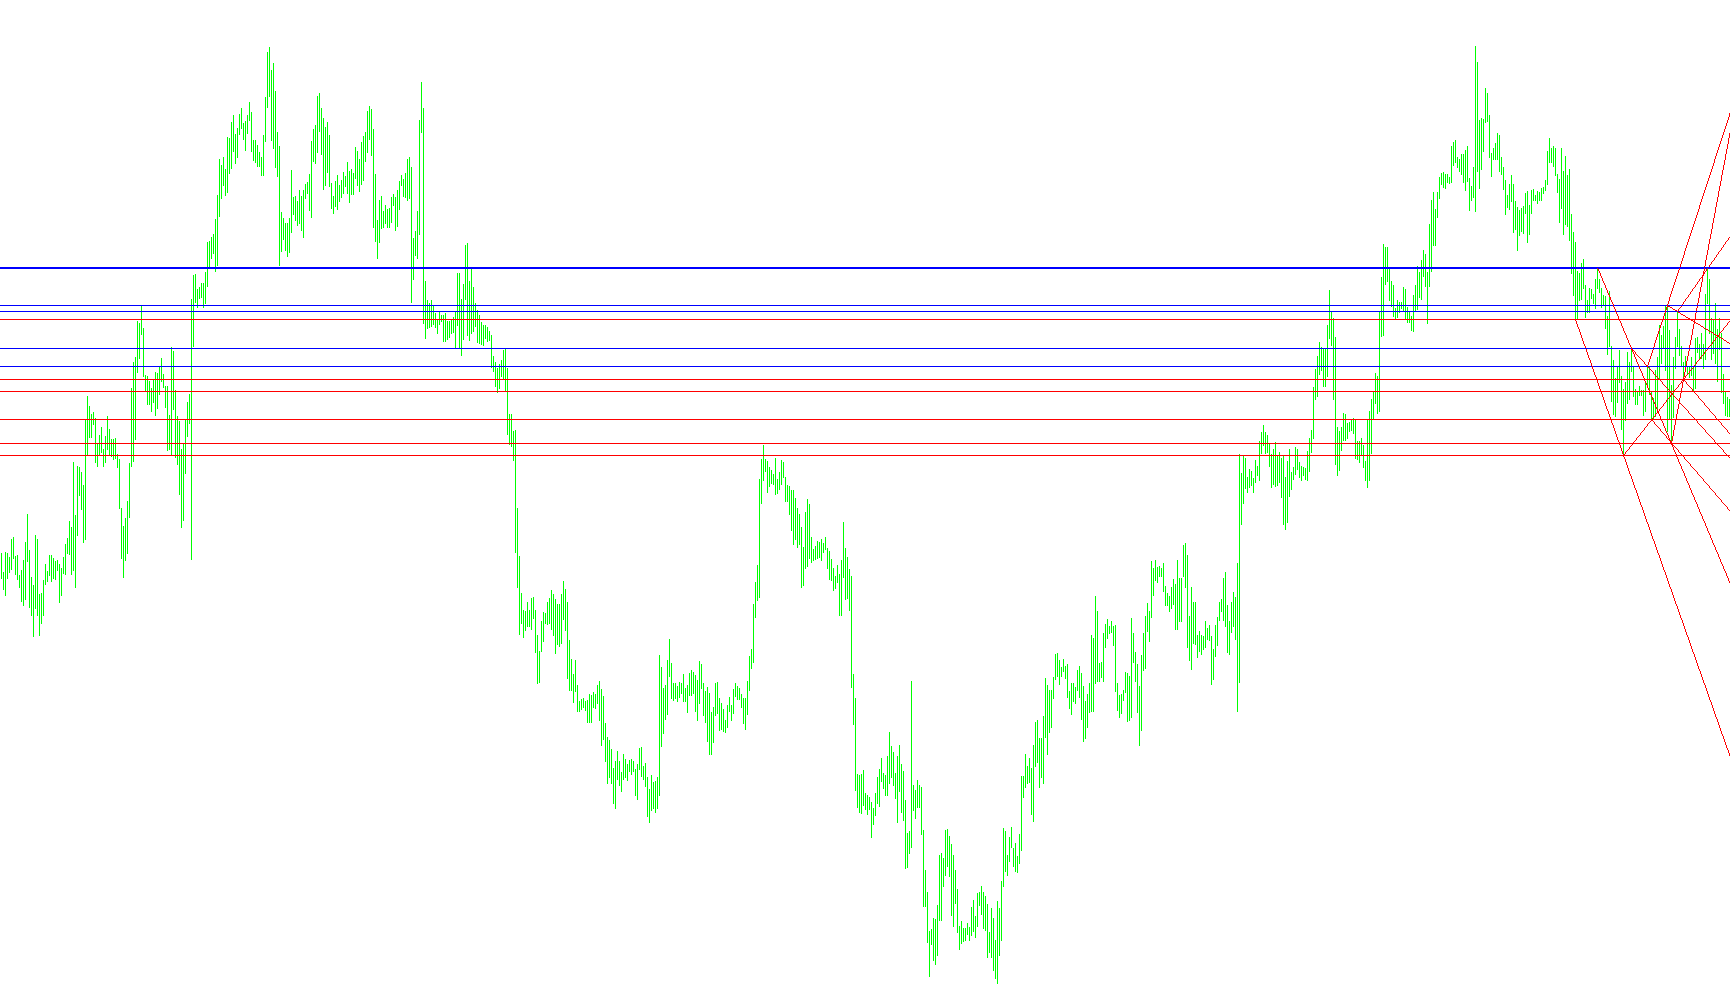
This script is a specialized technical analysis tool designed to identify and visualize significant price structures on a trading chart. Rather than using standard moving averages, it focuses on pinpointing the exact "peaks" and "valleys" of price action to help traders understand the underlying trend.
Core Functionality
The logic operates by scanning historical price data to find specific high and low points over a defined period (the "Lookback Period"). By identifying these extremes, the script maps out the market's structural framework.
Key features include:
- Support Level Identification (Down Trends): The tool scans for the lowest prices reached during specific intervals. It then stores and tracks the six most recent "low" points. These are represented on your chart as red horizontal lines and trend lines, highlighting areas where the price has historically struggled to drop further.
- Resistance Level Identification (Up Trends): Simultaneously, the tool identifies the highest prices reached during those same intervals. It stores the six most recent "high" points, displaying them as blue horizontal lines and trend lines. These represent "ceilings" where the price has faced selling pressure.
- Dynamic Visual Mapping: As new price data arrives, the script automatically updates these levels. If a new peak or valley is formed that fits the criteria, the indicators shift to reflect the most current market structure, ensuring the visual guide remains relevant to real-time movements.
How It Helps Traders
Instead of cluttering the screen with hundreds of data points, this script simplifies the "noise" of the market. It provides a clear visual summary of:
- Historical Benchmarks: Where the price has reacted in the past.
- Trend Direction: By observing the relationship between the blue (resistance) and red (support) levels.
- Price Structure: It allows you to see the "skeleton" of the market, making it easier to spot potential reversal zones or trend continuations based on previous price behavior.
10
Views
0
Downloads
0
Favorites
WSOWROTrend_v1
/*-----------------------------+
|			       |
| Shared by www.Aptrafx.com    |
|			       |
+------------------------------*/

//+------------------------------------------------------------------+
//|                                       Ind-WSO+WRO+Trend Line.mq4 |
//|                    Copyright © 2004, http://www.expert-mt4.nm.ru |
//|                                      http://www.expert-mt4.nm.ru |
//+------------------------------------------------------------------+
#property copyright "nsi2000"
#property link      "http://www.expert-mt4.nm.ru"

#property indicator_chart_window
//---- input parameters
extern int nPeriod=9;
extern int Limit=350;
///---- int Widners Oscilator
int cnt,nCurBar=0;

//+------------------------------------------------------------------+
//| Custom indicator initialization function                         |
//+------------------------------------------------------------------+
int init()
  {
//---- Output in Char
   for(cnt=0; cnt<=5; cnt++)
    {
      ObjectCreate("WSO-"+cnt,OBJ_HLINE,0,0,0);
      ObjectSet("WSO-"+cnt,OBJPROP_COLOR,Red);
   if(cnt<5)
      {
      ObjectCreate("Trend DN-"+cnt,OBJ_TREND,0,0,0,0,0);
      ObjectSet("Trend DN-"+cnt,OBJPROP_COLOR,Red);
      }
//----
      ObjectCreate("WRO-"+cnt,OBJ_HLINE,0,0,0);
      ObjectSet("WRO-"+cnt,OBJPROP_COLOR,Blue);
   if(cnt<5)
      {
      ObjectCreate("Trend UP-"+cnt,OBJ_TREND,0,0,0,0,0);
      ObjectSet("Trend Up-"+cnt,OBJPROP_COLOR,Blue);
      }
    }
//----
   return(0);
  }
//+------------------------------------------------------------------+
//| Custor indicator deinitialization function                       |
//+------------------------------------------------------------------+
int deinit()
  {
//---- TODO: add your code here
   for(cnt=0; cnt<=5; cnt++)
      {
      ObjectDelete("Trend UP-"+cnt);
      ObjectDelete("Trend DN-"+cnt);
      ObjectDelete("WSO-"+cnt);
      ObjectDelete("WRO-"+cnt);
      }
//----
   return(0);
  }
//+------------------------------------------------------------------+
//| Custom indicator iteration function                              |
//+------------------------------------------------------------------+
int start()
  {
//---- TODO: add your code here
   double r1,r2,r3,r4,r5,r6;
   int rt1,rt2,rt3,rt4,rt5,rt6;
   double s1,s2,s3,s4,s5,s6;
   int st1,st2,st3,st4,st5,st6;
//---- Ëèíèè ñîïðîòèâëåíèÿ è ïîääåðæêè
if(Bars<Limit) Limit=Bars-nPeriod;
for(nCurBar=Limit; nCurBar>0; nCurBar--)
   {
   if(Low[nCurBar+(nPeriod-1)/2] == Low[Lowest(NULL,0,MODE_LOW,nPeriod,nCurBar)])
      {
      s6=s5; s5=s4; s4=s3; s3=s2; s2=s1; s1=Low[nCurBar+(nPeriod-1)/2];
      st6=st5; st5=st4; st4=st3; st3=st2; st2=st1; st1=nCurBar+(nPeriod-1)/2;
      }
   if(High[nCurBar+(nPeriod-1)/2] == High[Highest(NULL,0,MODE_HIGH,nPeriod,nCurBar)])
      {
      r6=r5; r5=r4; r4=r3; r3=r2; r2=r1; r1=High[nCurBar+(nPeriod-1)/2];
      rt6=rt5; rt5=rt4; rt4=rt3; rt3=rt2; rt2=rt1; rt1=nCurBar+(nPeriod-1)/2;
      }
   }
//---- Move Object in Chart
ObjectMove("WSO-0",0,Time[st1],s1);
ObjectMove("Trend DN-0",1,Time[st1],s1);
ObjectMove("Trend DN-0",0,Time[st2],s2);
ObjectMove("WSO-1",0,Time[st2],s2);
ObjectMove("Trend DN-1",1,Time[st2],s2);
ObjectMove("Trend DN-1",0,Time[st3],s3);
ObjectMove("WSO-2",0,Time[st3],s3);
ObjectMove("Trend DN-2",1,Time[st3],s3);
ObjectMove("Trend DN-2",0,Time[st4],s4);
ObjectMove("WSO-3",0,Time[st4],s4);
ObjectMove("Trend DN-3",1,Time[st4],s4);
ObjectMove("Trend DN-3",0,Time[st5],s5);
ObjectMove("WSO-4",0,Time[st5],s5);
ObjectMove("Trend DN-4",1,Time[st5],s5);
ObjectMove("Trend DN-4",0,Time[st6],s6);
ObjectMove("WSO-5",0,Time[st6],s6);
//----
ObjectMove("WRO-0",0,Time[rt1],r1);
ObjectMove("Trend UP-0",1,Time[rt1],r1);
ObjectMove("Trend UP-0",0,Time[rt2],r2);
ObjectMove("WRO-1",0,Time[rt2],r2);
ObjectMove("Trend UP-1",1,Time[rt2],r2);
ObjectMove("Trend UP-1",0,Time[rt3],r3);
ObjectMove("WRO-2",0,Time[rt3],r3);
ObjectMove("Trend UP-2",1,Time[rt3],r3);
ObjectMove("Trend UP-2",0,Time[rt4],r4);
ObjectMove("WRO-3",0,Time[rt4],r4);
ObjectMove("Trend UP-3",1,Time[rt4],r4);
ObjectMove("Trend UP-3",0,Time[rt5],r5);
ObjectMove("WRO-4",0,Time[rt5],r5);
ObjectMove("Trend UP-4",1,Time[rt5],r5);
ObjectMove("Trend UP-4",0,Time[rt6],r6);
ObjectMove("WRO-5",0,Time[rt6],r6);
//----
   return(0);
  }
//--------------------------------------------------+
Comments