X0diagram1
Download script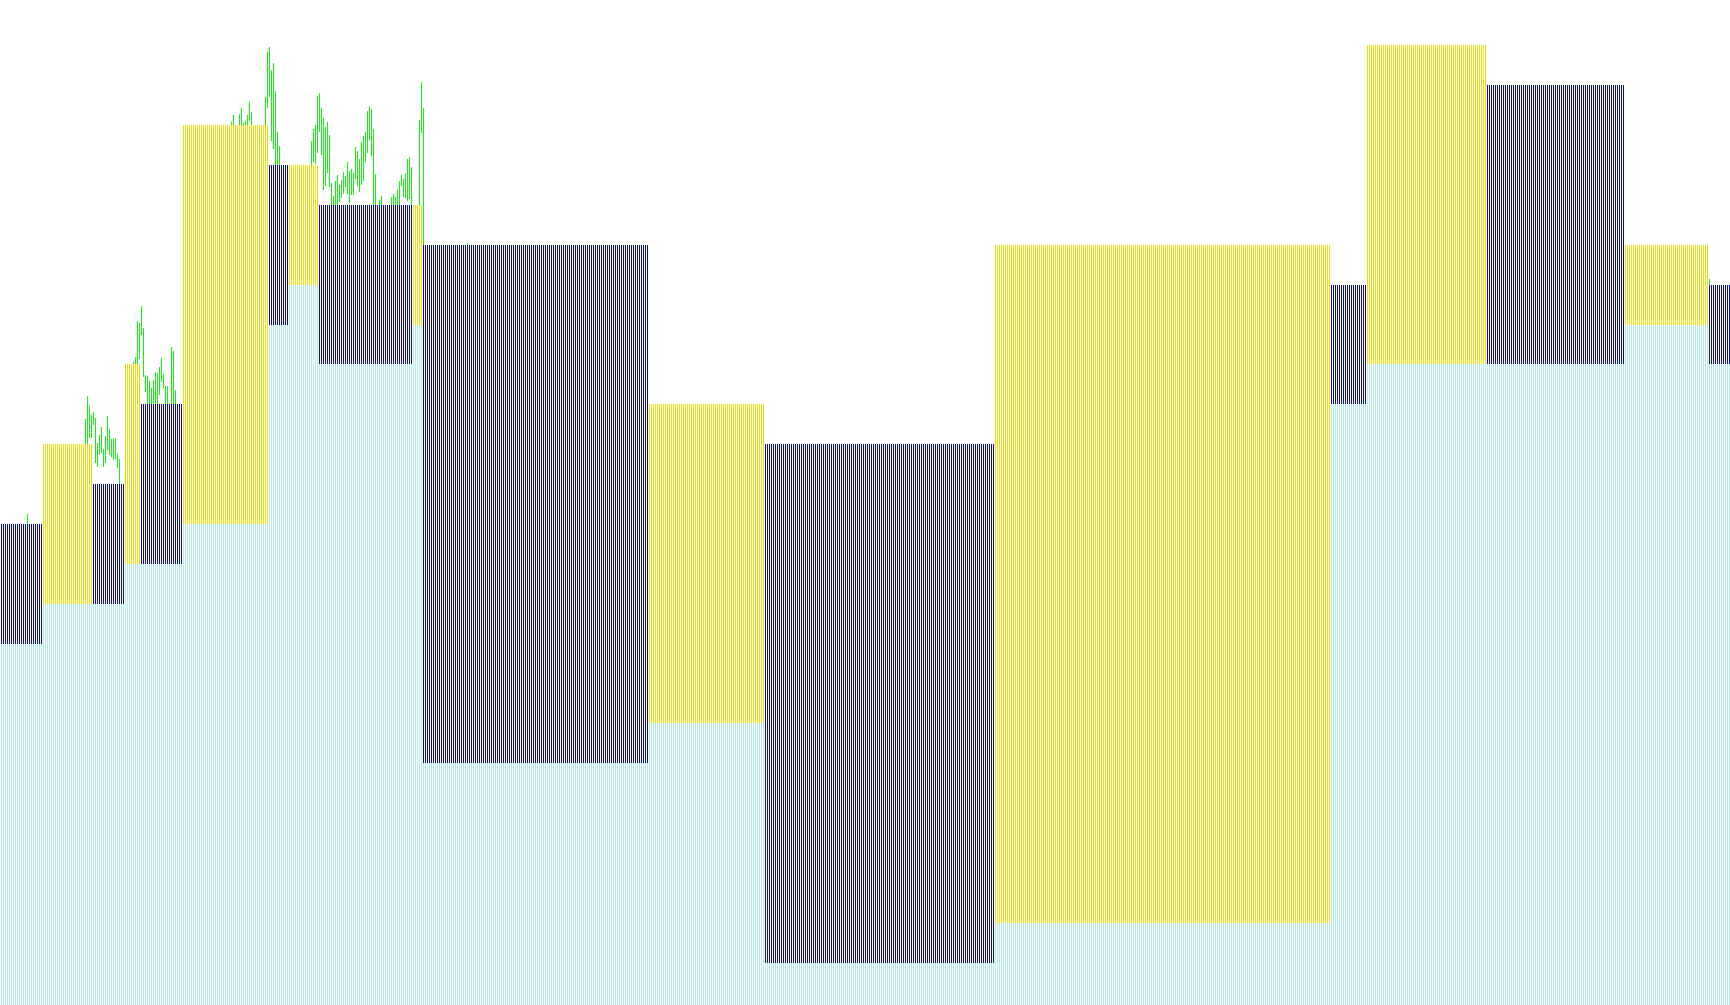
Technical Logic Overview
This script is designed as a visual analytics tool for MetaTrader that tracks and maps market price movements based on specific geometric "boxes." Instead of showing standard lines or dots, it interprets price action through the lens of significant structural reversals.
Core Operational Logic
The script works by scanning historical price data to identify significant upward and downward trends. It treats the market as a series of blocks rather than continuous fluid motion. Here is how it processes that information:
- Trend Identification: The tool begins by determining the initial direction of the market (up or down) based on the first available candle in its calculation range.
- Reversal Detection: It continuously monitors price fluctuations to find "turning points." A reversal is confirmed only when the price moves against the current trend by a specific, user-defined distance (the "Reversal Box"). This ensures that minor market noise is ignored and only substantial shifts are recorded.
- Geometric Mapping: Once a reversal is detected, the script calculates the total magnitude of that move. It then divides that movement into equal segments (boxes).
- Visual Representation:
- When the market moves up, it marks the progress with specific indicators to show the "stairs" of the ascent.
- When the market moves down, it uses a different visual marking to illustrate the descent.
- The tool effectively creates a simplified, stepped diagram of the price history, highlighting how many "boxes" of movement occurred between each major reversal point.
Key Functional Parameters
To tailor the behavior of this logic, the script utilizes three main variables:
- Box Size: This defines the measurement unit for the market movement. It determines how large each individual step in the diagram will be.
- Reversal Box: This acts as a sensitivity filter. It dictates how many "Box Sizes" must occur before the script acknowledges that a trend has officially changed direction. A higher number makes the indicator less sensitive to small price fluctuations.
- Candles: This tells the script how far back into the past it should look to begin drawing the diagram.
Summary of Behavior
In essence, this script filters out "market noise" and translates complex price action into a structured, visual summary of major trends. It allows a user to see the market not as a jagged line, but as a series of calculated blocks, making it easier to visualize the scale and direction of significant price movements.
//+------------------------------------------------------------------+
//|                                                    X0diagram.mq4 |
//|                                             Copyright © 2005, 4e |
//|                                                                  |
//+------------------------------------------------------------------+

///////////////////////////////////////////////////////////////////////
//                            Äèàãðàììà Õ0
// Ðèñóåò äèàãðàììû Õ0 ïî öåíàì çàêðûòèÿ
// Âõîäíûå ïàðàìåòðû: BoxSize - ðàçìåð áîêñà â ïóíêòàõ
//                    ReversalBox - êîë-âî áîêñîâ äëÿ ðàçâîðîòà
//                    Candles = êîë-âî ñâå÷åé äëÿ ïîäñ÷åòà
//
//  Èçìåíèòå ïàðàìåòð indicator_color3 öâåòîì âàøåé öâåòîâîé ñõåìû
///////////////////////////////////////////////////////////////////////


#property copyright "Copyright © 2005, 4e"
#property link      "4ebur@mail.ru"

#property indicator_separate_window
#property indicator_buffers 3
#property indicator_color1 Red
#property indicator_color2 Blue
#property indicator_color3 White


extern double BoxSize = 100;
extern int ReversalBox = 3;
extern int Candles = 3000;


double PointArray[];
double FigureArray[];
double ZeroArray[];


//+------------------------------------------------------------------+
//| Custom indicator initialization function                         |
//+------------------------------------------------------------------+
int init()
  {
//---- indicators
SetIndexBuffer(0,PointArray);
SetIndexBuffer(1,FigureArray);
SetIndexBuffer(2,ZeroArray);


SetIndexStyle(0,DRAW_HISTOGRAM);
SetIndexStyle(1,DRAW_HISTOGRAM);
SetIndexStyle(2,DRAW_HISTOGRAM);

SetIndexEmptyValue(0,0);
SetIndexEmptyValue(1,0);
SetIndexEmptyValue(2,0);

//----
   return(0);
  }
//+------------------------------------------------------------------+
//| Custom indicator deinitialization function                       |
//+------------------------------------------------------------------+
int deinit()
  {
//----

//----
   return(0);
  }
//+------------------------------------------------------------------+
//| Custom indicator iteration function                              |
//+------------------------------------------------------------------+
int start()
  {
     int    limit;
   int    counted_bars=IndicatorCounted();

//---- last counted bar will be recounted
   if(counted_bars>0) counted_bars--;
   limit=Bars-counted_bars;

//----

double BoxPointSize = BoxSize * Point; //Ðàçìåð áîêñà â ïóíòàõ
double ReversalSize = BoxPointSize * ReversalBox; // Ðàçìåð ðàçâîðîòà â ïóíêòàõ


  // Èíèöèàëèçàöèÿ ìàññèâîâ
  for(int i=limit;i>0;i--)
    {
      PointArray[i] = 0;
      FigureArray[i] = 0;
      ZeroArray[i] = 0;


    }


  int  beginPoint; // Òî÷êà îòñ÷åòà
  int  CurPoint; //Òåêóùàÿ òî÷êà
  bool Direction; // 1  - ââåðõ, òèïà Õ, 0-âíèç, òèïà 0
  int LocalÌin; // Ëîêàëüíûé ìèíèìóì
  int LocalMax; // Ëîêàëüíûé ìàêñèìóì
  double beginIndex; // èíäåõ íà÷àëà îòñ÷åòà

  // Àëãîðèòì ðàñ÷åòà òàêîâ: Êàê òîëüêî ïðîèçîøåë ðàçâîðîò, ðèñóåì ïðîøëóþ äèàãðàììó, è æäåì ñëåäóþùåãî ðàçâîðîòà
  // Íà÷àëüíîå íàïðàâëåíèå èäåíòèôèöèðóåòñÿ ïî ïåðâîé ñâå÷å(áåëàÿ - çíà÷èð ââåðõ, ÷åðíàÿ - âíèç)


  Direction = (Close[Candles]-Open[Candles]) > 0;// Çàäàåì íà÷àëüíîå íàïðàâëåíèå
  beginPoint = Candles; // Íà÷àëüíàÿ òî÷êà îòñ÷åòà
  CurPoint = Candles;   // Íà÷àëüíàÿ òåêóùàÿ òî÷êà
  LocalMax = Candles; // Íà÷àëüíûé ìàêñèìóì
  LocalÌin = Candles; // Íà÷àëüíûé ìèíèìóì
  beginIndex = Close[beginPoint]; // Íà÷àëüíûé èíäåêñ


   for( i=Candles-1;i>0;i--)
    {
      CurPoint = i; // Ñäâèã òåêóùåé òî÷êè
      LocalMax = Highest(NULL,0,MODE_CLOSE,beginPoint-CurPoint,CurPoint);
      LocalÌin = Lowest(NULL,0,MODE_CLOSE,beginPoint-CurPoint,CurPoint);

         if(Direction) // Ââåðõ
            {
               if(Close[LocalMax]-Close[CurPoint] >= ReversalSize) // Ðàçâîðîò âíèç
               {
                    int boxes  = MathFloor(((Close[LocalMax]-Close[beginPoint])/(BoxSize*Point))); // âû÷èñëÿåì êîë-âî áîêñîâ

                     for(int j=beginPoint;j>LocalMax-1;j--)
                     {
                        PointArray[j] = beginIndex + BoxSize*boxes*Point; //Ðèñóåì èêñû
                        ZeroArray[j] = beginIndex;  // Ïðîáåëû

                     }

                   beginPoint = LocalMax-1; // Ñäâèãàåì íà÷àëüíóþ òî÷êó íà áûâøèé ìàêñèìóì
                   beginIndex = beginIndex + BoxSize*(boxes-1)*Point; // Ñäâèãàåì èíäåêñ íà îäèí áîêñ âíèç
                   LocalÌin = CurPoint;
                   Direction = 0; // Óêàçûâàåì ÷òî íà÷àëîñü äâèæåíèå âíèç
               }
            }


          else  // Âíèç
            {
               if(Close[CurPoint]-Close[LocalÌin] >=ReversalSize) // Ðàçâîðîò ââåðõ
               {

                      boxes  = MathFloor(((Close[beginPoint]-Close[LocalÌin])/(BoxSize*Point)));// âû÷èñëÿåì êîë-âî áîêñîâ

                     for( j=beginPoint;j>LocalÌin-1;j--)
                     {
                        FigureArray[j] = beginIndex; //Ðèñóåì íóëè
                        ZeroArray[j] = beginIndex-BoxSize*boxes*Point;   // Ïðîáåëû

                     }

                   beginPoint = LocalÌin-1; // Ñäâèãàåì íà÷àëüíóþ òî÷êó íà áûâøèé ìàêñèìóì
                   Direction = 1; // Óêàçûâàåì ÷òî íà÷àëîñü äâèæåíèå âíèç
                   LocalMax = CurPoint;
                   beginIndex = beginIndex - BoxSize*(boxes-1)*Point; // Ñäâèãàåì èíäåêñ íà îäèí áîêñ ââåðõ


               }
            }
    }


   // Ðèñóåì òåêóùèé ðàçâîðîò


   if(Direction)
   {
         LocalMax = Highest(NULL,0,MODE_CLOSE,beginPoint-CurPoint,CurPoint);
         boxes  = MathFloor(((Close[LocalMax]-Close[beginPoint])/(BoxSize*Point))); // âû÷èñëÿåì êîë-âî áîêñîâ

         for(j=beginPoint;j>0;j--)
                     {
                        PointArray[j] = beginIndex + BoxSize*boxes*Point; //Ðèñóåì èêñû
                        ZeroArray[j] = beginIndex;  // Ïðîáåëû

                     }


   }

   else
   {
       LocalÌin = Lowest(NULL,0,MODE_CLOSE,beginPoint-CurPoint,CurPoint);
      boxes  = MathFloor(((Close[beginPoint]-Close[LocalÌin])/(BoxSize*Point)));// âû÷èñëÿåì êîë-âî áîêñîâ

      for(j=beginPoint;j>0;j--)
                     {
                        FigureArray[j] =  beginIndex;//Ðèñóåì íóëè
                        ZeroArray[j] = beginIndex - BoxSize*boxes*Point;  // Ïðîáåëû

                     }


   }


//----
   return(0);
  }
//+------------------------------------------------------------------+
Comments