X0diagram1_v1
Download script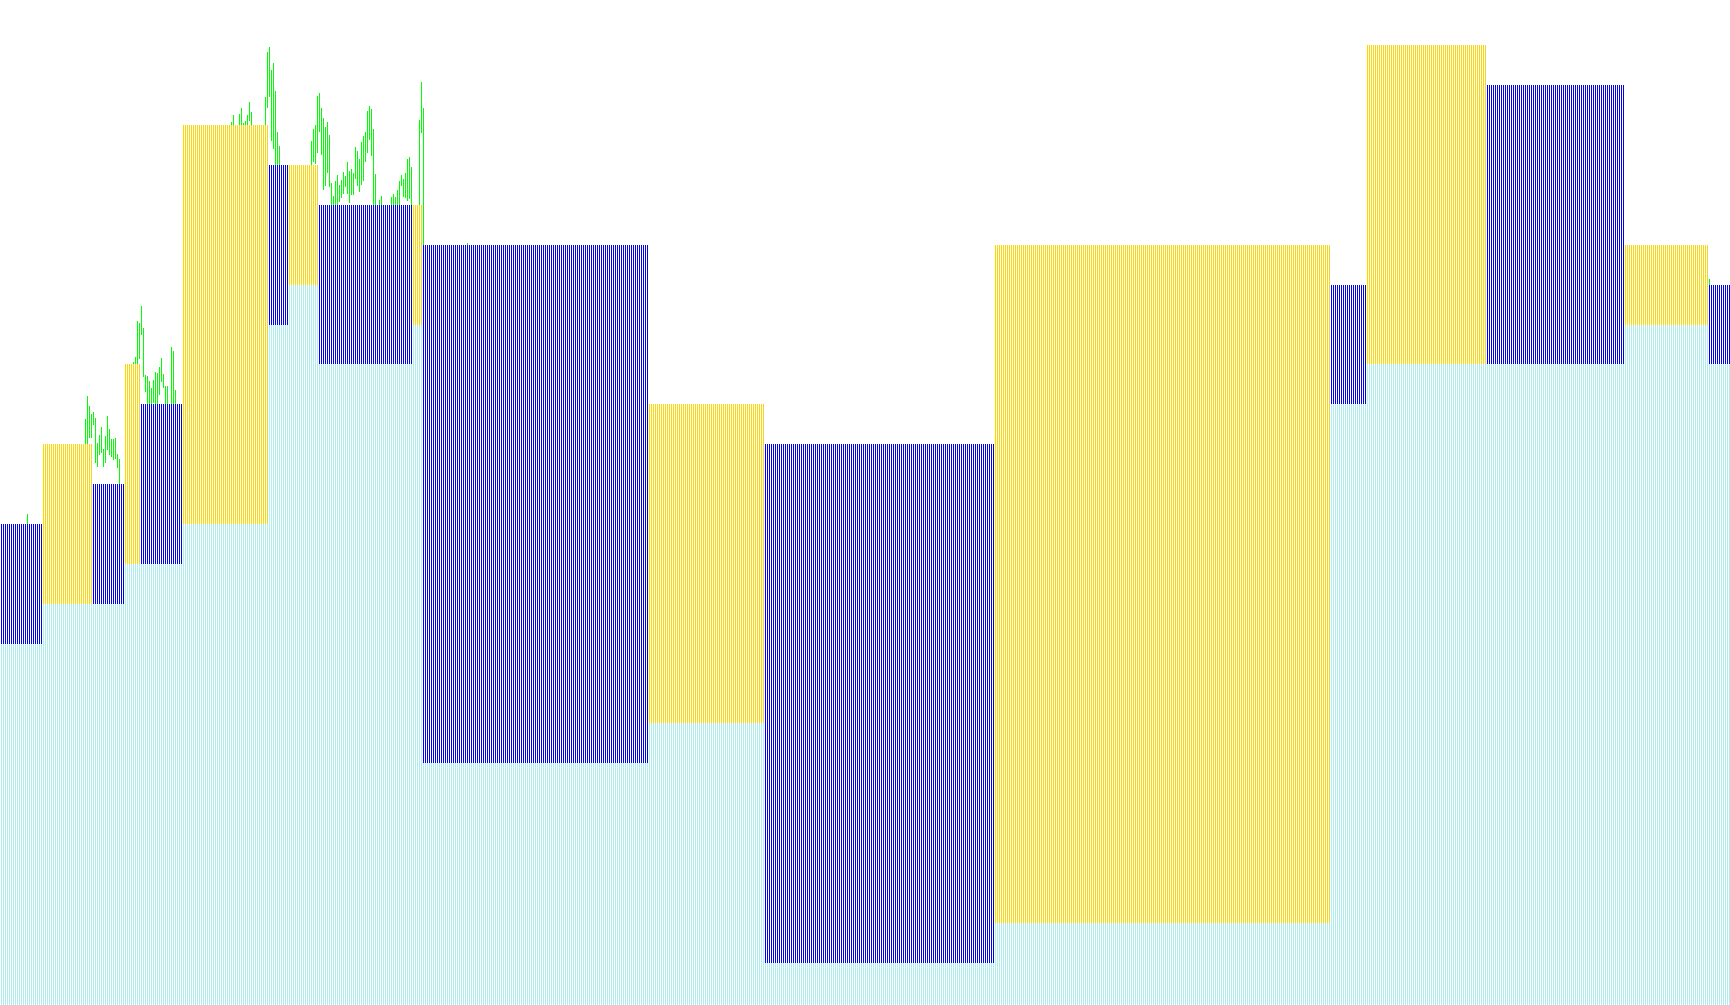
This script is designed as a specialized visual analytics tool for MetaTrader, intended to help traders identify and visualize significant price movements and reversals through a geometric "box" system. Rather than traditional trendlines or moving averages, it uses a mathematical approach to measure market momentum and structural shifts.
Core Logic and Functionality
The indicator operates by monitoring price action over a specific historical period (defined by the user) to detect when a market trend has moved far enough to be considered a "reversal." Here is how the logic flows:
1. Trend Identification & Detection The script begins by analyzing the initial price direction (upward or downward). It then continuously scans the price history to identify "local highs" and "local lows." It specifically looks for moments where the price deviates significantly from its starting point—reaching a threshold defined by the user as a "Reversal Box."
2. Dynamic Geometric Drawing When the script detects that a price movement has reached this reversal threshold, it triggers a visual construction:
- Upward Movements: If the market is moving up and hits a reversal point, the script calculates how many "boxes" of price action occurred. It then draws vertical indicators (histograms) to represent these segments.
- Downward Movements: Conversely, if the market turns downward, it calculates the depth of the move and renders corresponding visual markers.
3. Automatic Scaling and Tracking The logic is dynamic. Instead of drawing a single line, it treats each movement as a series of stacked units. When a new reversal occurs:
- It "closes" the previous calculation.
- It resets its starting point to the new peak or trough.
- It calculates the new distance to determine the size of the next set of visual markers.
User Customization Parameters
To tailor the behavior of these visuals, the script provides three primary controls:
- BoxSize: This defines the smallest unit of measurement for the price action. It determines the "granularity" of the bars drawn on your chart.
- ReversalBox: This acts as the sensitivity trigger. It tells the script how many units of movement are required before it officially recognizes a trend shift and draws a new set of markers. A higher number will result in fewer, larger visual movements; a lower number will capture smaller, more frequent fluctuations.
- Candles: This determines the depth of historical data the script will analyze to build its initial logic.
Summary for the Trader
Essentially, this tool cleans up "market noise" by ignoring minor price flickers and only highlighting major structural shifts. It converts raw price movement into a quantifiable, visual history of trend reversals, allowing you to see the magnitude of past moves and identify where significant turning points occurred in the market's lifecycle.
//+------------------------------------------------------------------+
//| Ðèñóåò äèàãðàììû Õ0 ïî öåíàì çàêðûòèÿ                            |
//| Âõîäíûå ïàðàìåòðû: BoxSize - ðàçìåð áîêñà â ïóíêòàõ              |
//|                    ReversalBox - êîë-âî áîêñîâ äëÿ ðàçâîðîòà     |
//|                    Candles = êîë-âî ñâå÷åé äëÿ ïîäñ÷åòà          |
//|                                                                  |
//|  Èçìåíèòå ïàðàìåòð indicator_color3 öâåòîì âàøåé öâåòîâîé ñõåìû  |
//+------------------------------------------------------------------+
#property copyright "Copyright © 2005, 4e"
#property link      "4ebur@mail.ru"
//----
#property indicator_separate_window
#property indicator_buffers 3
#property indicator_color1 Red
#property indicator_color2 Blue
#property indicator_color3 White
//----
extern double BoxSize=100;
extern int ReversalBox=3;
extern int Candles=3000;
//----
double PointArray[];
double FigureArray[];
double ZeroArray[];
//+------------------------------------------------------------------+
//| Custom indicator initialization function                         |
//+------------------------------------------------------------------+
int init()
  {
//---- indicators
   SetIndexBuffer(0,PointArray);
   SetIndexBuffer(1,FigureArray);
   SetIndexBuffer(2,ZeroArray);
   //
   SetIndexStyle(0,DRAW_HISTOGRAM);
   SetIndexStyle(1,DRAW_HISTOGRAM);
   SetIndexStyle(2,DRAW_HISTOGRAM);
   //
   SetIndexEmptyValue(0,0);
   SetIndexEmptyValue(1,0);
   SetIndexEmptyValue(2,0);
//----
   return(0);
  }
//+------------------------------------------------------------------+
//| Custom indicator deinitialization function                       |
//+------------------------------------------------------------------+
int deinit()
  {
//----
//----
   return(0);
  }
//+------------------------------------------------------------------+
//| Custom indicator iteration function                              |
//+------------------------------------------------------------------+
int start()
  {
   int    limit;
   int    counted_bars=IndicatorCounted();
//---- last counted bar will be recounted
   if(counted_bars>0) counted_bars--;
   limit=Bars-counted_bars;
//----
   double BoxPointSize=BoxSize * Point; //Ðàçìåð áîêñà â ïóíòàõ
   double ReversalSize=BoxPointSize * ReversalBox; // Ðàçìåð ðàçâîðîòà â ïóíêòàõ
   // Èíèöèàëèçàöèÿ ìàññèâîâ
   for(int i=limit;i>0;i--)
     {
      PointArray[i]=0;
      FigureArray[i]=0;
      ZeroArray[i]=0;
     }
   int  beginPoint;    // Òî÷êà îòñ÷åòà
   int  CurPoint;      //Òåêóùàÿ òî÷êà
   bool Direction;     // 1  - ââåðõ, òèïà Õ, 0-âíèç, òèïà 0
   int LocalÌin;       // Ëîêàëüíûé ìèíèìóì
   int LocalMax;       // Ëîêàëüíûé ìàêñèìóì
   double beginIndex;  // èíäåõ íà÷àëà îòñ÷åòà
   // Àëãîðèòì ðàñ÷åòà òàêîâ: Êàê òîëüêî ïðîèçîøåë ðàçâîðîò, ðèñóåì ïðîøëóþ äèàãðàììó, è æäåì ñëåäóþùåãî ðàçâîðîòà
   // Íà÷àëüíîå íàïðàâëåíèå èäåíòèôèöèðóåòñÿ ïî ïåðâîé ñâå÷å(áåëàÿ - çíà÷èð ââåðõ, ÷åðíàÿ - âíèç)
   Direction=(Close[Candles]-Open[Candles]) > 0;// Çàäàåì íà÷àëüíîå íàïðàâëåíèå
   beginPoint=Candles; // Íà÷àëüíàÿ òî÷êà îòñ÷åòà
   CurPoint=Candles;   // Íà÷àëüíàÿ òåêóùàÿ òî÷êà
   LocalMax=Candles;   // Íà÷àëüíûé ìàêñèìóì
   LocalÌin=Candles;   // Íà÷àëüíûé ìèíèìóì
   beginIndex=Close[beginPoint]; // Íà÷àëüíûé èíäåêñ
//----
   for( i=Candles-1;i>0;i--)
     {
      CurPoint=i; // Ñäâèã òåêóùåé òî÷êè
      LocalMax=Highest(NULL,0,MODE_CLOSE,beginPoint-CurPoint,CurPoint);
      LocalÌin=Lowest(NULL,0,MODE_CLOSE,beginPoint-CurPoint,CurPoint);
      if(Direction) // Ââåðõ
        {
         if(Close[LocalMax]-Close[CurPoint]>=ReversalSize) // Ðàçâîðîò âíèç
           {
            int boxes =MathFloor(((Close[LocalMax]-Close[beginPoint])/(BoxSize*Point))); // âû÷èñëÿåì êîë-âî áîêñîâ
            for(int j=beginPoint;j>LocalMax-1;j--)
              {
               PointArray[j]=beginIndex + BoxSize*boxes*Point; //Ðèñóåì èêñû
               ZeroArray[j]=beginIndex;  // Ïðîáåëû
              }
            beginPoint=LocalMax-1; // Ñäâèãàåì íà÷àëüíóþ òî÷êó íà áûâøèé ìàêñèìóì
            beginIndex=beginIndex + BoxSize*(boxes-1)*Point; // Ñäâèãàåì èíäåêñ íà îäèí áîêñ âíèç
            LocalÌin=CurPoint;
            Direction=0; // Óêàçûâàåì ÷òî íà÷àëîñü äâèæåíèå âíèç
           }
        }
      else  // Âíèç
        {
         if(Close[CurPoint]-Close[LocalÌin] >=ReversalSize) // Ðàçâîðîò ââåðõ
           {
            boxes =MathFloor(((Close[beginPoint]-Close[LocalÌin])/(BoxSize*Point)));// âû÷èñëÿåì êîë-âî áîêñîâ
//----
            for( j=beginPoint;j>LocalÌin-1;j--)
              {
               FigureArray[j]=beginIndex; //Ðèñóåì íóëè
               ZeroArray[j]=beginIndex-BoxSize*boxes*Point;   // Ïðîáåëû
              }
            beginPoint=LocalÌin-1; // Ñäâèãàåì íà÷àëüíóþ òî÷êó íà áûâøèé ìàêñèìóì
            Direction=1; // Óêàçûâàåì ÷òî íà÷àëîñü äâèæåíèå âíèç
            LocalMax=CurPoint;
            beginIndex=beginIndex - BoxSize*(boxes-1)*Point; // Ñäâèãàåì èíäåêñ íà îäèí áîêñ ââåðõ
           }
        }
     }
   // Ðèñóåì òåêóùèé ðàçâîðîò
   if(Direction)
     {
      LocalMax=Highest(NULL,0,MODE_CLOSE,beginPoint-CurPoint,CurPoint);
      boxes =MathFloor(((Close[LocalMax]-Close[beginPoint])/(BoxSize*Point))); // âû÷èñëÿåì êîë-âî áîêñîâ
//----
      for(j=beginPoint;j>0;j--)
        {
         PointArray[j]=beginIndex + BoxSize*boxes*Point; //Ðèñóåì èêñû
         ZeroArray[j]=beginIndex;  // Ïðîáåëû
        }
     }
   else
     {
      LocalÌin=Lowest(NULL,0,MODE_CLOSE,beginPoint-CurPoint,CurPoint);
      boxes =MathFloor(((Close[beginPoint]-Close[LocalÌin])/(BoxSize*Point)));// âû÷èñëÿåì êîë-âî áîêñîâ

      for(j=beginPoint;j>0;j--)
        {
         FigureArray[j]= beginIndex;//Ðèñóåì íóëè
         ZeroArray[j]=beginIndex - BoxSize*boxes*Point;  // Ïðîáåëû
        }
     }
//----
   return(0);
  }
//+------------------------------------------------------------------+
Comments