WSOWROTrend
Download script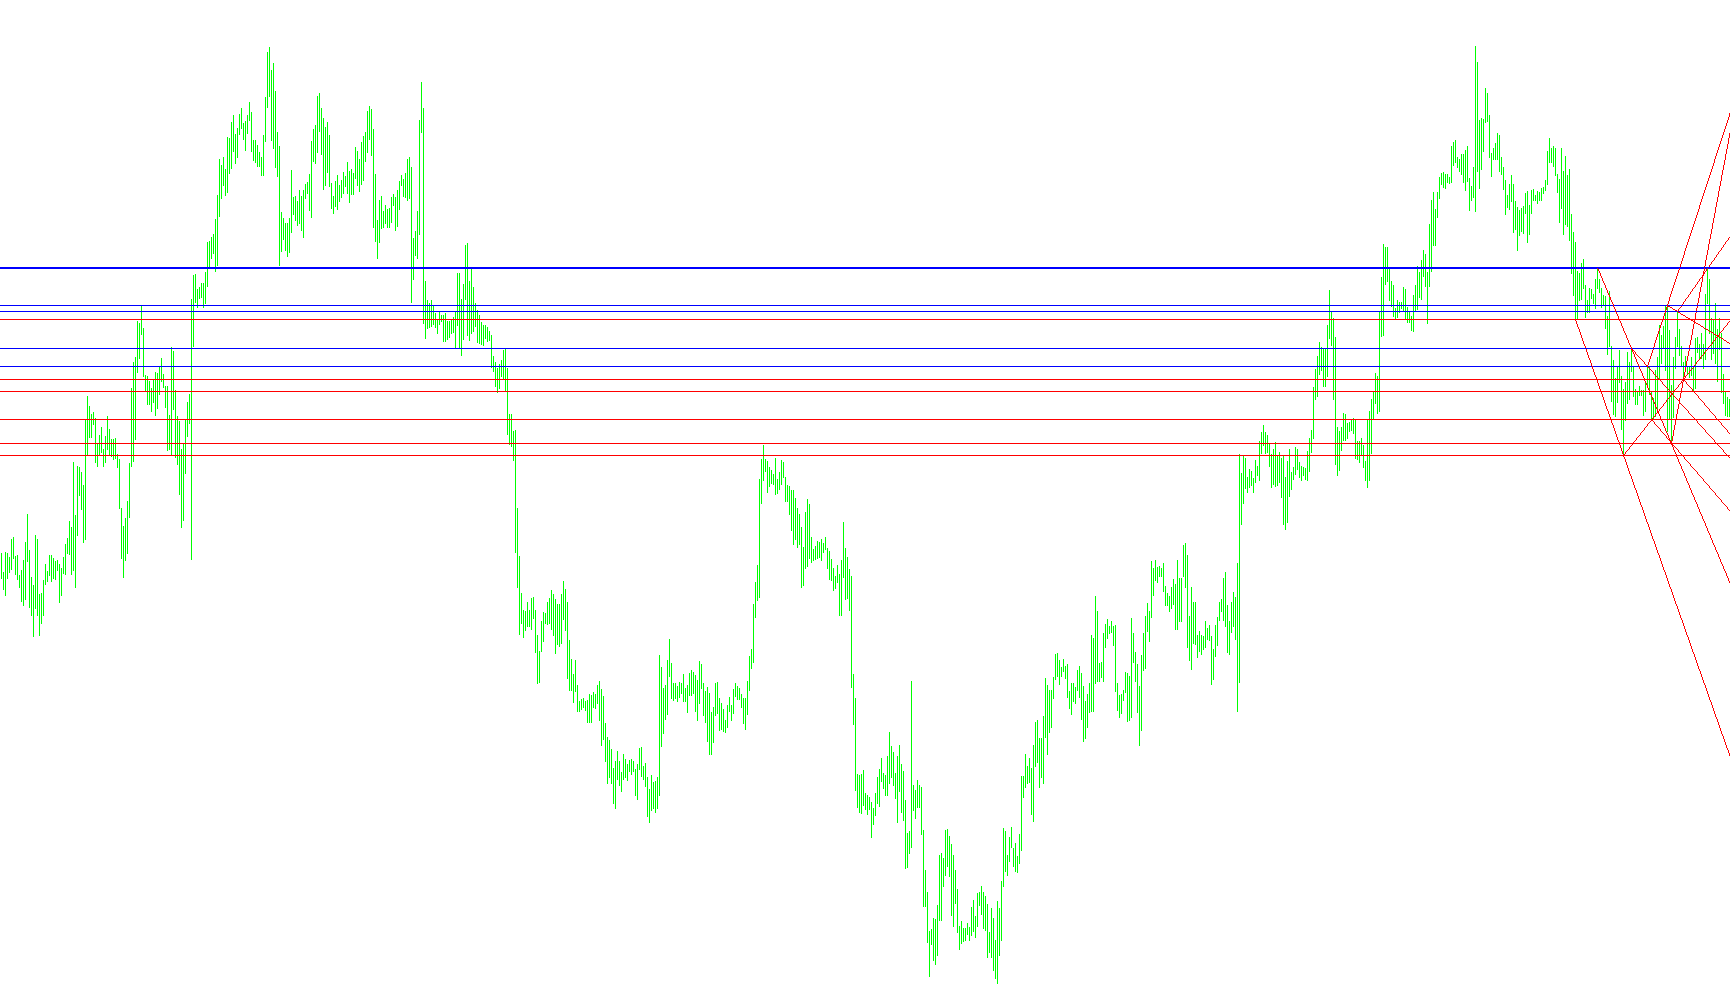
This script is designed to provide a visual representation of market price action by identifying and highlighting significant structural points on a trading chart. It focuses on detecting historical "peaks" and "valleys"—the specific points where the price reached its highest or lowest levels over a set period.
Core Logic Overview
The tool scans past price data to locate the most significant turning points. Instead of just showing a single point, it identifies the six most recent significant highs and six most recent significant lows. By isolating these points, the script helps traders see the "skeleton" of the market trend, making it easier to identify where support and resistance levels are forming.
Key Components of the Analysis
- High/Low Detection: The logic calculates the highest and lowest prices over a specific timeframe (defined by the period setting). When it finds a new peak or valley, it records both the price level and the exact time it occurred.
- Dynamic Ranking: The script maintains a list of these identified points. As new price action develops, it updates these rankings to ensure that only the most relevant, recent structural levels are displayed on the screen.
- Visual Indicators: To make this data actionable for the user, the script draws two types of visual elements:
- Horizontal Markers (WSO/WRO): These act as flat lines at specific price levels to highlight where the market has previously "bounced" or "rejected" price.
- Trend Lines: These connect the identified highs and lows, creating a visual path that illustrates the direction and momentum of the current trend.
Visual Differentiation
To help with quick analysis, the script uses a color-coded system:
- Red Elements: Specifically track "lows" and downward price movements (resistance/support bottoms).
- Blue Elements: Specifically track "highs" and upward price movements (resistance/support tops).
Summary for the Trader
Essentially, this script automates the tedious task of manually looking back at history to find where the price turned around. It cleans up the chart by drawing clear lines at historical peaks and valleys, allowing you to see the prevailing market structure and potential areas of interest at a glance.
//+------------------------------------------------------------------+
//|                                       Ind-WSO+WRO+Trend Line.mq4 |
//|                    Copyright © 2004, http://www.expert-mt4.nm.ru |
//|                                      http://www.expert-mt4.nm.ru |
//+------------------------------------------------------------------+
#property copyright "nsi2000"
#property link      "http://www.expert-mt4.nm.ru"

#property indicator_chart_window
//---- input parameters
extern int nPeriod=9;
extern int Limit=350;
///---- int Widners Oscilator
int cnt,nCurBar=0;

//+------------------------------------------------------------------+
//| Custom indicator initialization function                         |
//+------------------------------------------------------------------+
int init()
  {
//---- Output in Char
   for(cnt=0; cnt<=5; cnt++)
    {
      ObjectCreate("WSO-"+cnt,OBJ_HLINE,0,0,0);
      ObjectSet("WSO-"+cnt,OBJPROP_COLOR,Red);
   if(cnt<5)
      {
      ObjectCreate("Trend DN-"+cnt,OBJ_TREND,0,0,0,0,0);
      ObjectSet("Trend DN-"+cnt,OBJPROP_COLOR,Red);
      }
//----
      ObjectCreate("WRO-"+cnt,OBJ_HLINE,0,0,0);
      ObjectSet("WRO-"+cnt,OBJPROP_COLOR,Blue);
   if(cnt<5)
      {
      ObjectCreate("Trend UP-"+cnt,OBJ_TREND,0,0,0,0,0);
      ObjectSet("Trend Up-"+cnt,OBJPROP_COLOR,Blue);
      }
    }
//----
   return(0);
  }
//+------------------------------------------------------------------+
//| Custor indicator deinitialization function                       |
//+------------------------------------------------------------------+
int deinit()
  {
//---- TODO: add your code here
   for(cnt=0; cnt<=5; cnt++)
      {
      ObjectDelete("Trend UP-"+cnt);
      ObjectDelete("Trend DN-"+cnt);
      ObjectDelete("WSO-"+cnt);
      ObjectDelete("WRO-"+cnt);
      }
//----
   return(0);
  }
//+------------------------------------------------------------------+
//| Custom indicator iteration function                              |
//+------------------------------------------------------------------+
int start()
  {
//---- TODO: add your code here
   double r1,r2,r3,r4,r5,r6;
   int rt1,rt2,rt3,rt4,rt5,rt6;
   double s1,s2,s3,s4,s5,s6;
   int st1,st2,st3,st4,st5,st6;
//---- Ëèíèè ñîïðîòèâëåíèÿ è ïîääåðæêè
if(Bars<Limit) Limit=Bars-nPeriod;
for(nCurBar=Limit; nCurBar>0; nCurBar--)
   {
   if(Low[nCurBar+(nPeriod-1)/2] == Low[Lowest(NULL,0,MODE_LOW,nPeriod,nCurBar)])
      {
      s6=s5; s5=s4; s4=s3; s3=s2; s2=s1; s1=Low[nCurBar+(nPeriod-1)/2];
      st6=st5; st5=st4; st4=st3; st3=st2; st2=st1; st1=nCurBar+(nPeriod-1)/2;
      }
   if(High[nCurBar+(nPeriod-1)/2] == High[Highest(NULL,0,MODE_HIGH,nPeriod,nCurBar)])
      {
      r6=r5; r5=r4; r4=r3; r3=r2; r2=r1; r1=High[nCurBar+(nPeriod-1)/2];
      rt6=rt5; rt5=rt4; rt4=rt3; rt3=rt2; rt2=rt1; rt1=nCurBar+(nPeriod-1)/2;
      }
   }
//---- Move Object in Chart
ObjectMove("WSO-0",0,Time[st1],s1);
ObjectMove("Trend DN-0",1,Time[st1],s1);
ObjectMove("Trend DN-0",0,Time[st2],s2);
ObjectMove("WSO-1",0,Time[st2],s2);
ObjectMove("Trend DN-1",1,Time[st2],s2);
ObjectMove("Trend DN-1",0,Time[st3],s3);
ObjectMove("WSO-2",0,Time[st3],s3);
ObjectMove("Trend DN-2",1,Time[st3],s3);
ObjectMove("Trend DN-2",0,Time[st4],s4);
ObjectMove("WSO-3",0,Time[st4],s4);
ObjectMove("Trend DN-3",1,Time[st4],s4);
ObjectMove("Trend DN-3",0,Time[st5],s5);
ObjectMove("WSO-4",0,Time[st5],s5);
ObjectMove("Trend DN-4",1,Time[st5],s5);
ObjectMove("Trend DN-4",0,Time[st6],s6);
ObjectMove("WSO-5",0,Time[st6],s6);
//----
ObjectMove("WRO-0",0,Time[rt1],r1);
ObjectMove("Trend UP-0",1,Time[rt1],r1);
ObjectMove("Trend UP-0",0,Time[rt2],r2);
ObjectMove("WRO-1",0,Time[rt2],r2);
ObjectMove("Trend UP-1",1,Time[rt2],r2);
ObjectMove("Trend UP-1",0,Time[rt3],r3);
ObjectMove("WRO-2",0,Time[rt3],r3);
ObjectMove("Trend UP-2",1,Time[rt3],r3);
ObjectMove("Trend UP-2",0,Time[rt4],r4);
ObjectMove("WRO-3",0,Time[rt4],r4);
ObjectMove("Trend UP-3",1,Time[rt4],r4);
ObjectMove("Trend UP-3",0,Time[rt5],r5);
ObjectMove("WRO-4",0,Time[rt5],r5);
ObjectMove("Trend UP-4",1,Time[rt5],r5);
ObjectMove("Trend UP-4",0,Time[rt6],r6);
ObjectMove("WRO-5",0,Time[rt6],r6);
//----
   return(0);
  }
//--------------------------------------------------+
Comments