WPRSI_signal_V.2
Download script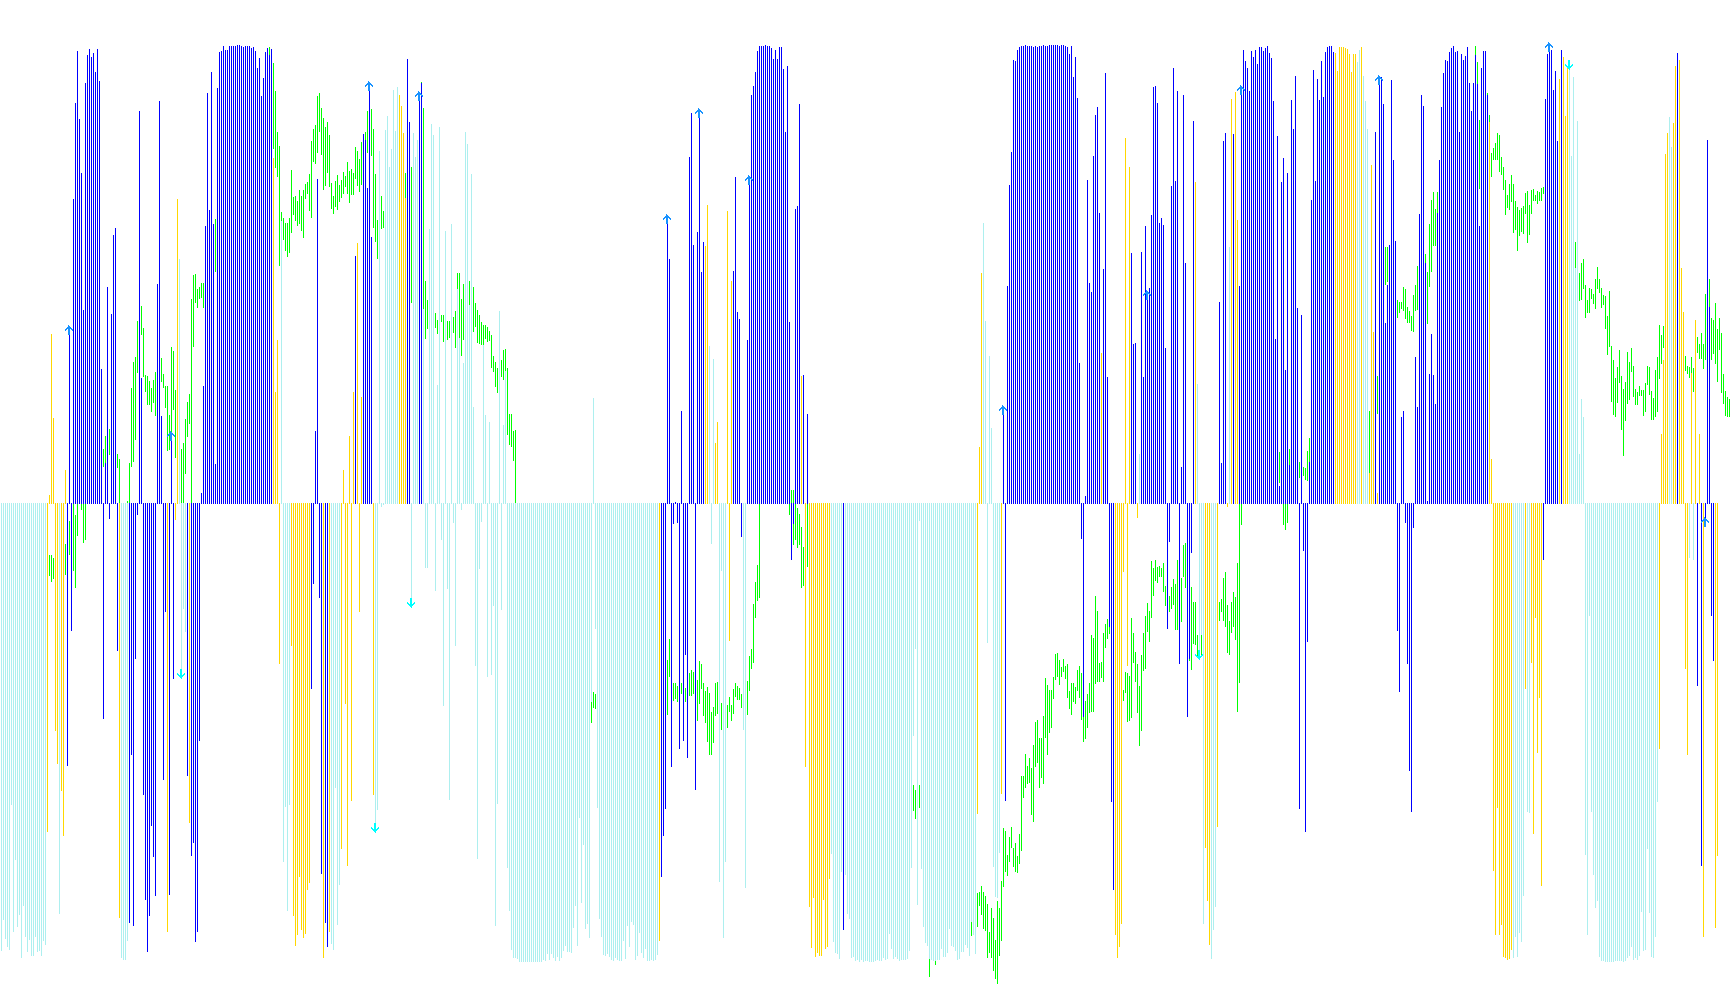
The WPRSI signal V2 is a technical analysis tool designed to identify potential market trends and entry points by combining several momentum oscillators into a single visual interface. Instead of relying on a single metric, it cross-references different types of price movement data to filter out "noise" and highlight significant shifts in market direction.
Core Methodology
The logic operates by monitoring two primary indicators simultaneously: the Williams %R (which measures overbought/oversold conditions) and the Relative Strength Index (RSI) (which measures the speed and change of price movements). By comparing where these two indicators sit relative to specific thresholds, the script determines the market's current "mood."
Key Analytical Functions
The tool performs four distinct checks to identify different types of market signals:
- Trend Identification: The script looks for "divergence" or opposing movements between the RSI and Williams %R. When these two indicators provide conflicting data (e.g., one suggests strength while the other suggests weakness), the tool calculates a cumulative price movement score over a specific period to see if the trend is gaining enough momentum to be valid.
- Bullish Momentum Confirmation: It monitors for specific "Buy" conditions where both the RSI and Williams %R align in a positive direction. If this alignment occurs, it validates the move by calculating the ratio of price progress (how far the price traveled relative to the total range of that bar) over a multi-bar window.
- Advanced Entry Signals (Arrows): The script includes sophisticated "filter" logic to identify precise turning points.
- For Upside: It looks for a specific crossover in the Williams %R while ensuring that the price hasn't already moved too far. It then scans a "look-back" window to ensure the move is isolated and not part of a larger, exhausted trend before placing a visual arrow on the chart.
- For Downside: Similarly, it monitors for a downward crossover in the Williams %R while checking the RSI. It applies a secondary filter to ensure the price hasn't already bottomed out before providing a downward signal.
Visual Output and Calculation
To make this data easy to read, the script uses a mathematical formula (a hyperbolic tangent function) to convert raw price movement scores into a normalized format. This allows the results to be displayed as:
- Histograms: These provide a visual representation of the ongoing momentum strength for various market conditions.
- Arrows: These serve as immediate visual alerts for confirmed entry points where the filtered conditions have been met.
By combining these elements, the script aims to provide a comprehensive view of market sentiment, distinguishing between a standard price fluctuation and a significant trend change.
//+------------------------------------------------------------------+
//|                                              WPRSI signal V2.mq4 |
//|                                                           gumgum |
//|                                           1967policmen@gmail.com |
//+------------------------------------------------------------------+
#property copyright "gumgum"
#property link      "1967policmen@gmail.com"

#property  indicator_separate_window
#property indicator_buffers 5
#property indicator_color1 Gray
#property indicator_color2 Blue
#property indicator_color3 Red
#property indicator_color4 Blue
#property indicator_color5 Red
#property  indicator_width1  5
//---- input parameters
extern int WPRSIperiod  =27;
extern int Waytoway     =27;
extern int filterUP     =10;
extern int filterDN     =10;
//---- buffers
double ExtMapBuffer1[];
double ExtMapBuffer2[];
double ExtMapBuffer3[];
double ExtMapBuffer4[];
double ExtMapBuffer5[];
//----


//+------------------------------------------------------------------+
//| Custom indicator initialization function                         |
//+------------------------------------------------------------------+
int init()
  {
//---- indicators
SetIndexStyle(2,DRAW_HISTOGRAM,0,0);
SetIndexBuffer(2, ExtMapBuffer3);
//----
SetIndexStyle(0,DRAW_HISTOGRAM,0,0);
SetIndexBuffer(0, ExtMapBuffer1);
//----
SetIndexStyle(1,DRAW_HISTOGRAM,0,0);
SetIndexBuffer(1, ExtMapBuffer2);
//----
SetIndexStyle(3,DRAW_ARROW,0,0);
SetIndexArrow(3, 233);
SetIndexBuffer(3, ExtMapBuffer4);
//----
SetIndexStyle(4,DRAW_ARROW,0,0);
SetIndexArrow(4, 234);
SetIndexBuffer(4, ExtMapBuffer5);

//---- name for DataWindow and indicator subwindow label
   IndicatorShortName("WPRSI sinal v.2("+WPRSIperiod+","+Waytoway+","+filterUP+","+filterDN+")");
//----

   return(0);
  }
//+------------------------------------------------------------------+
//| Custor indicator deinitialization function                       |
//+------------------------------------------------------------------+
int deinit()
  {
//----
   return(0);
  }
//+------------------------------------------------------------------+
//| Custom indicator iteration function                              |
//+------------------------------------------------------------------+
int start()
  {
   int limit;
   int counted_bars=IndicatorCounted();
//---- check for possible errors
   if(counted_bars < 0)
      return(-1);
//---- last counted bar will be recounted
   if(counted_bars > 0)
      counted_bars--;
   limit=Bars - counted_bars;
//----

   for(int i=1; i < limit; i++)
     {
      //---
               double upsum=0;
               int up1;
               if(((iWPR(NULL,0,WPRSIperiod,i)>-50)&&(iRSI(NULL,0,WPRSIperiod,PRICE_MEDIAN,i)<50))||((iWPR(NULL,0,WPRSIperiod,i)<-50)&&(iRSI(NULL,0,WPRSIperiod,PRICE_MEDIAN,i)>50)))
               {
               upsum=0;
               for(up1=0;up1<=Waytoway;up1++)
               {
               upsum=(Close[i+up1]-Open[i+up1])/(High[i+up1]-Low[i+up1])+upsum;
               }
               ExtMapBuffer1[i]=logic(upsum);
               }
      //----
      if((iWPR(NULL,0,WPRSIperiod,i)>-50)&&(iRSI(NULL,0,WPRSIperiod,PRICE_MEDIAN,i)>50))
      {
               upsum=0;
               for(up1=0;up1<=Waytoway;up1++)
               {
               upsum=(Close[i+up1]-Open[i+up1])/(High[i+up1]-Low[i+up1])+upsum;
               }
               ExtMapBuffer2[i]=logic(upsum);
      }
      //----
      if( (iWPR(NULL,0,WPRSIperiod,i)>-20)&&(iWPR(NULL,0,WPRSIperiod,i+1)<-20)&&(iRSI(NULL,0,WPRSIperiod,PRICE_MEDIAN,i)>50)           )
         {
         double z=0;
         for(int k=2;k<=filterUP+2;k++)
         {

         if(iWPR(NULL,0,WPRSIperiod,k+i)>-20){z=1;  }

         }

               if(z==0)
               {
               upsum=0;
               for(up1=0;up1<=Waytoway;up1++)
               {
               upsum=(Close[i+up1]-Open[i+up1])/(High[i+up1]-Low[i+up1])+upsum;
               }
               ExtMapBuffer4[i]=logic(upsum);
               }
               }
      //----
      if((iWPR(NULL,0,WPRSIperiod,i)<-50)&&(iRSI(NULL,0,WPRSIperiod,PRICE_MEDIAN,i)<50))
      {
               upsum=0;
               for(up1=0;up1<=Waytoway;up1++)
               {
               upsum=(Close[i+up1]-Open[i+up1])/(High[i+up1]-Low[i+up1])+upsum;
               }
               ExtMapBuffer3[i]=logic(upsum);
      }
      //----
      if( (iWPR(NULL,0,WPRSIperiod,i+1)>-80)&&(iWPR(NULL,0,WPRSIperiod,i)<-80)&&(iRSI(NULL,0,WPRSIperiod,PRICE_MEDIAN,i)<50)           )

         {
         double h=0;
         for(int c=2;c<=filterDN+2;c++)
         {

         if(iWPR(NULL,0,WPRSIperiod,c+i)<-80){h=1;  }

         }

               if(h==0)
               {
               upsum=0;
               for(up1=0;up1<=Waytoway;up1++)
               {
               upsum=(Close[i+up1]-Open[i+up1])/(High[i+up1]-Low[i+up1])+upsum;
               }
               ExtMapBuffer5[i]=logic(upsum);
               }
               }


     }
//----
   return(0);
  }
double logic(double cinyan)///ôóíêöèÿ àêòèâàöèè íåéðîíîâ
{
//MathExp(cinyan)-MathExp(-cinyan))/(MathExp(cinyan)+MathExp(-cinyan);
return((MathExp(cinyan)-MathExp(-cinyan))/(MathExp(cinyan)+MathExp(-cinyan)));
}
//+------------------------------------------------------------------+
Comments