Xma_col[1]
Download script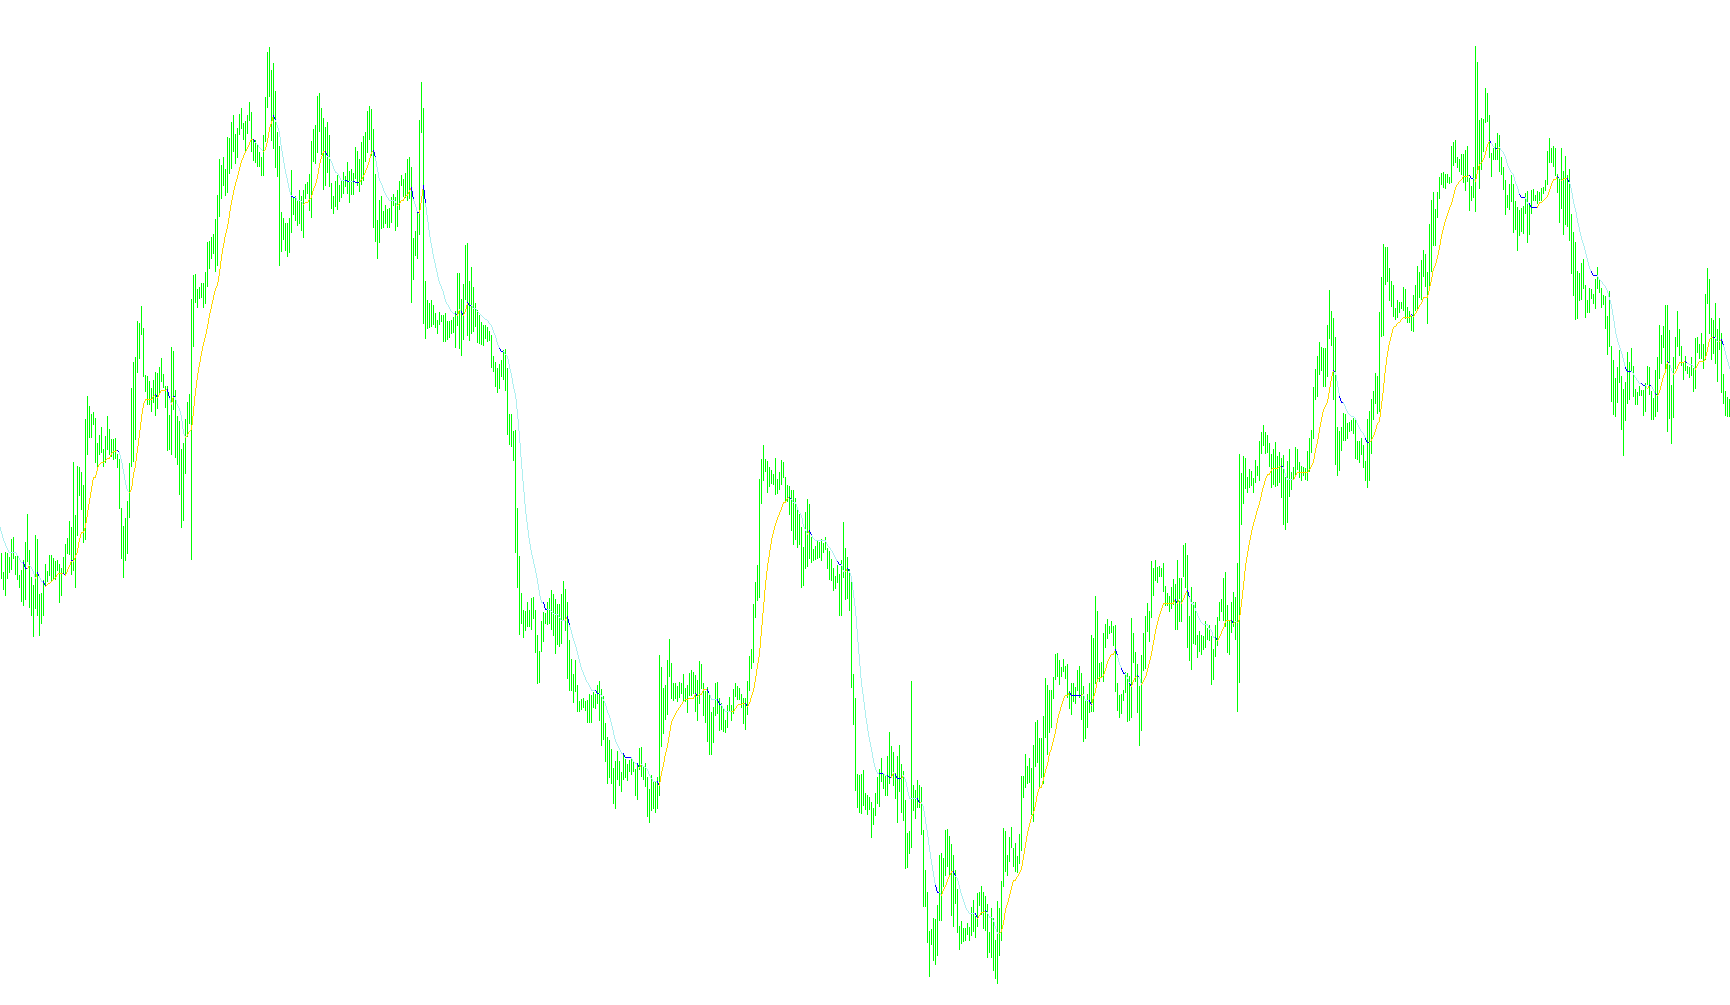
This script is a visual trading tool designed to help identify market trends and potential turning points by smoothing out price fluctuations. It acts as a dynamic line on your chart that highlights the general direction of the market while filtering out minor "noise."
Core Mechanics
The tool operates based on three primary logical layers:
1. Movement Smoothing The script calculates the average price over a specific timeframe (the "period"). By looking at these averages, it attempts to separate the long-term trend from short-term volatility. It specifically compares two different average readings to determine if the market has moved enough to warrant a change in the displayed signal.
2. The Threshold Filter A key feature of this logic is the "threshold" (porog). Instead of reacting to every tiny price tick, the script requires a minimum amount of movement before it acknowledges a trend shift. This prevents the indicator from becoming jagged or "jittery," ensuring that only significant price actions are captured.
3. Trend Detection and Coloring The most visible part of the script is how it handles direction:
- Trend Persistence: If the market movement is small, the script holds its previous position, maintaining a steady line.
- Directional Shifts: When the price movement exceeds the defined threshold, the script detects a change in momentum.
- Visual Feedback: The logic identifies whether the trend is moving upwards or downwards. It uses this information to assign specific colors (Blue and Red) to the lines on your chart. This provides an immediate visual cue: one color represents upward momentum, while the other represents downward momentum.
Summary for the User
In simple terms, this tool acts like a "smart" trend line. It waits for the market to show a clear, significant move before it confirms a change in direction. By doing this, it helps traders see the broader "flow" of the price action, making it easier to distinguish between a temporary fluctuation and a real trend reversal.
//+------------------------------------------------------------------+
//|                                                          Xma.mq4 |
//|                 Copyright © 2009, XrustSolution. Toys from Vinin.|
//|              http://www.xrust.ucoz.net  http://www.vinin.ucoz.ru |
//|                  xrust@land.ru  xrust@gmail.com  xrust@mksat.net |
//|      Õîòü äàííàÿ ïðîãðàììà è ÿâëÿåòñÿ ñâîáîäíî ðàñïðîñòðàíÿåìîé, |
//|           ïóáëèêàöèÿ åå áåç óêàçàíèÿ íà ïåðâîèñòî÷íèê çàïðåùåíà  |
//-------------------------------------------------------------------+
//mod col granit http://codebase.mql4.com/ru/5899

#property copyright "#Copyright © 2008, XrustSolution.#"
#property link      "#http://www.xrust.ucoz.net#"
#property indicator_chart_window
#property indicator_buffers 3
#property indicator_color1 Blue
#property indicator_color2 Red
#property indicator_color3 Red

extern int period=12;
extern int porog =3;
extern int metod =1;
extern int metod2=1;
extern int prise =0;
//---- buffers
double Signal[];
double Up[];
double Dn[];
//+------------------------------------------------------------------+
void init(){

   SetIndexBuffer(0,Signal);
   SetIndexBuffer(1,Dn);
   SetIndexBuffer(2,Up);

   IndicatorShortName("Xma_color"+period+porog);
return;}
//+------------------------------------------------------------------+
int start() {
   int limit;
   double tmp1,tmp2;
   int counted_bars=IndicatorCounted();
   int i;
   if(counted_bars<0) return(-1);
   if(counted_bars>0) counted_bars--;
   limit=Bars-counted_bars;
   for (i = limit;i>=0;i--){
     tmp1=iMA(Symbol(),0,period,0,metod,prise,i);
     tmp2=iMA(Symbol(),0,period,1,metod2,prise,i);
     if(MathAbs(tmp1-tmp2)>=porog*Point)
       Signal[i]=tmp2;
     else
       Signal[i]=Signal[i+1];


                                             Up[i]=EMPTY_VALUE;   Dn[i]=EMPTY_VALUE;


         if (Signal[i]<Signal[i+1])    {

               if (Dn[i+2]==EMPTY_VALUE)  {  Dn[i]=Signal[i];     Dn[i+1]=Signal[i+1]; }
               else                       {  Up[i]=Signal[i];     Up[i+1]=Signal[i+1]; }

                                       }

          if (Signal[i]==Signal[i+1])  {     Up[i]=Up[i+1];       Dn[i]=Dn[i+1];  }


   }


   return(0);
}
Comments