WPRslow
Download script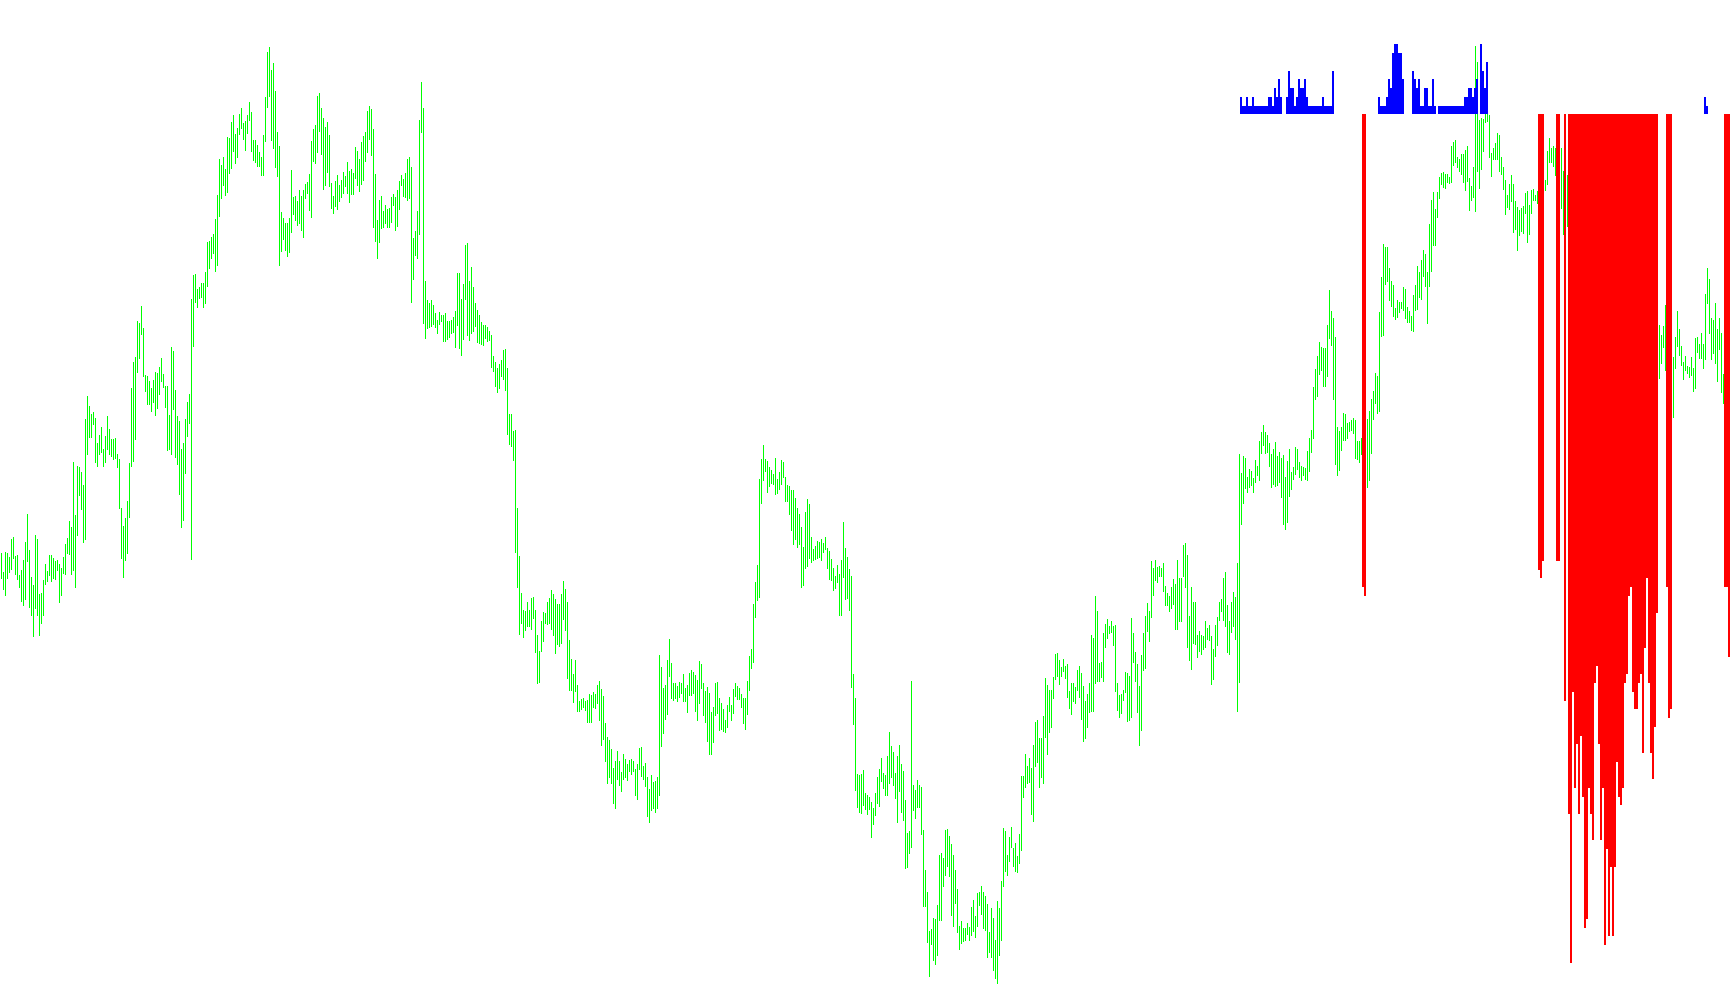
This tool is a specialized technical analysis indicator designed to help traders visualize market momentum and potential extremes. It functions by transforming standard price data into a visual histogram that highlights specific "overextended" zones.
Core Functionality
The script works by processing a modified version of the Williams Percent Range (WPR) calculation. Instead of showing every minor fluctuation in the market, it filters the data to focus on significant movements based on three primary settings:
- Sensitivity Window: It looks at a specific period of price history to determine the current momentum.
- Lower Threshold: It identifies when the price is moving into an area of "weakness" or potentially oversold conditions.
- Upper Threshold: It identifies when the price is moving into an area of "strength" or potentially overbought conditions.
How the Logic Works
The script performs a continuous scan of historical price bars (up to a user-defined limit). For each bar, it calculates a momentum value and then applies a mathematical rounding process to simplify the data into distinct levels.
The logic then places these values into two separate visual categories:
- The "Up" Momentum (Blue): If the calculated momentum falls below a specific lower limit, it is captured and displayed as a blue histogram. This represents segments where the price may be showing significant downward pressure or reaching a bottom zone.
- The "Down" Momentum (Red): If the calculated momentum exceeds a specific upper limit, it is inverted and displayed as a red histogram. This represents segments where the price may be showing significant upward pressure or reaching a peak zone.
Visual Output
Rather than a single continuous line, this indicator provides a clear, dual-colored histogram. By looking at the chart, a user can quickly identify periods of high intensity. When you see blue bars, the logic is signaling that the price has reached a defined lower boundary; when you see red bars, it signals that the price has breached a defined upper boundary. This allows for a cleaner interpretation of market extremes by filtering out the "noise" of everyday price movements.
//+------------------------------------------------------------------+
//|                                                      WPRslow.mq4 |
//|                                                                  |
//|                                        Ramdass - Conversion only |
//+------------------------------------------------------------------+
#property  copyright "Author - OlegVS"

#property indicator_separate_window
#property indicator_minimum -1.000000
#property indicator_maximum 1.000000
#property indicator_buffers 2
#property indicator_color1 Blue
#property indicator_color2 Red
//---- input parameters
extern int P=54;
extern int n1=9;
extern int n2=49;
extern int CountBars=300;
//---- buffers
double Up[];
double Down[];
//+------------------------------------------------------------------+
//| Custom indicator initialization function                         |
//+------------------------------------------------------------------+
int init()
  {
   string short_name;
//---- indicator line
   IndicatorBuffers(2);
   SetIndexStyle(0,DRAW_HISTOGRAM,STYLE_SOLID,2,Blue);
   SetIndexStyle(1,DRAW_HISTOGRAM,STYLE_SOLID,2,Red);
   SetIndexBuffer(0,Up);
   SetIndexBuffer(1,Down);
//----
//----
   return(0);
  }
//+------------------------------------------------------------------+
//| WPRslow                                                          |
//+------------------------------------------------------------------+
int start()
  {
   if (CountBars>Bars) CountBars=Bars;
   SetIndexDrawBegin(0,Bars-CountBars+P);
   SetIndexDrawBegin(1,Bars-CountBars+P);
   int i,counted_bars=IndicatorCounted();
   double V1,V2;
//----
   if(CountBars<=P) return(0);
//---- initial zero
   if(counted_bars<1)
   {
      for(i=1;i<=P;i++) Up[CountBars-i]=0.0;
      for(i=1;i<=P;i++) Down[CountBars-i]=0.0;
   }
//----
   i=CountBars-P-1;
   while(i>=0)
     {
Down[i]=0.0; Up[i]=0.0;
V1=iWPR(NULL,0,P,i)*iWPR(NULL,0,P,i)/100;
V2=MathCeil(V1);
if (V2<n1) {Up[i]=V2;}
if (V2>n2) {Down[i]=-(V2);}

      i--;
     }
   return(0);
  }
//+------------------------------------------------------------------+
Comments