VHF
Download script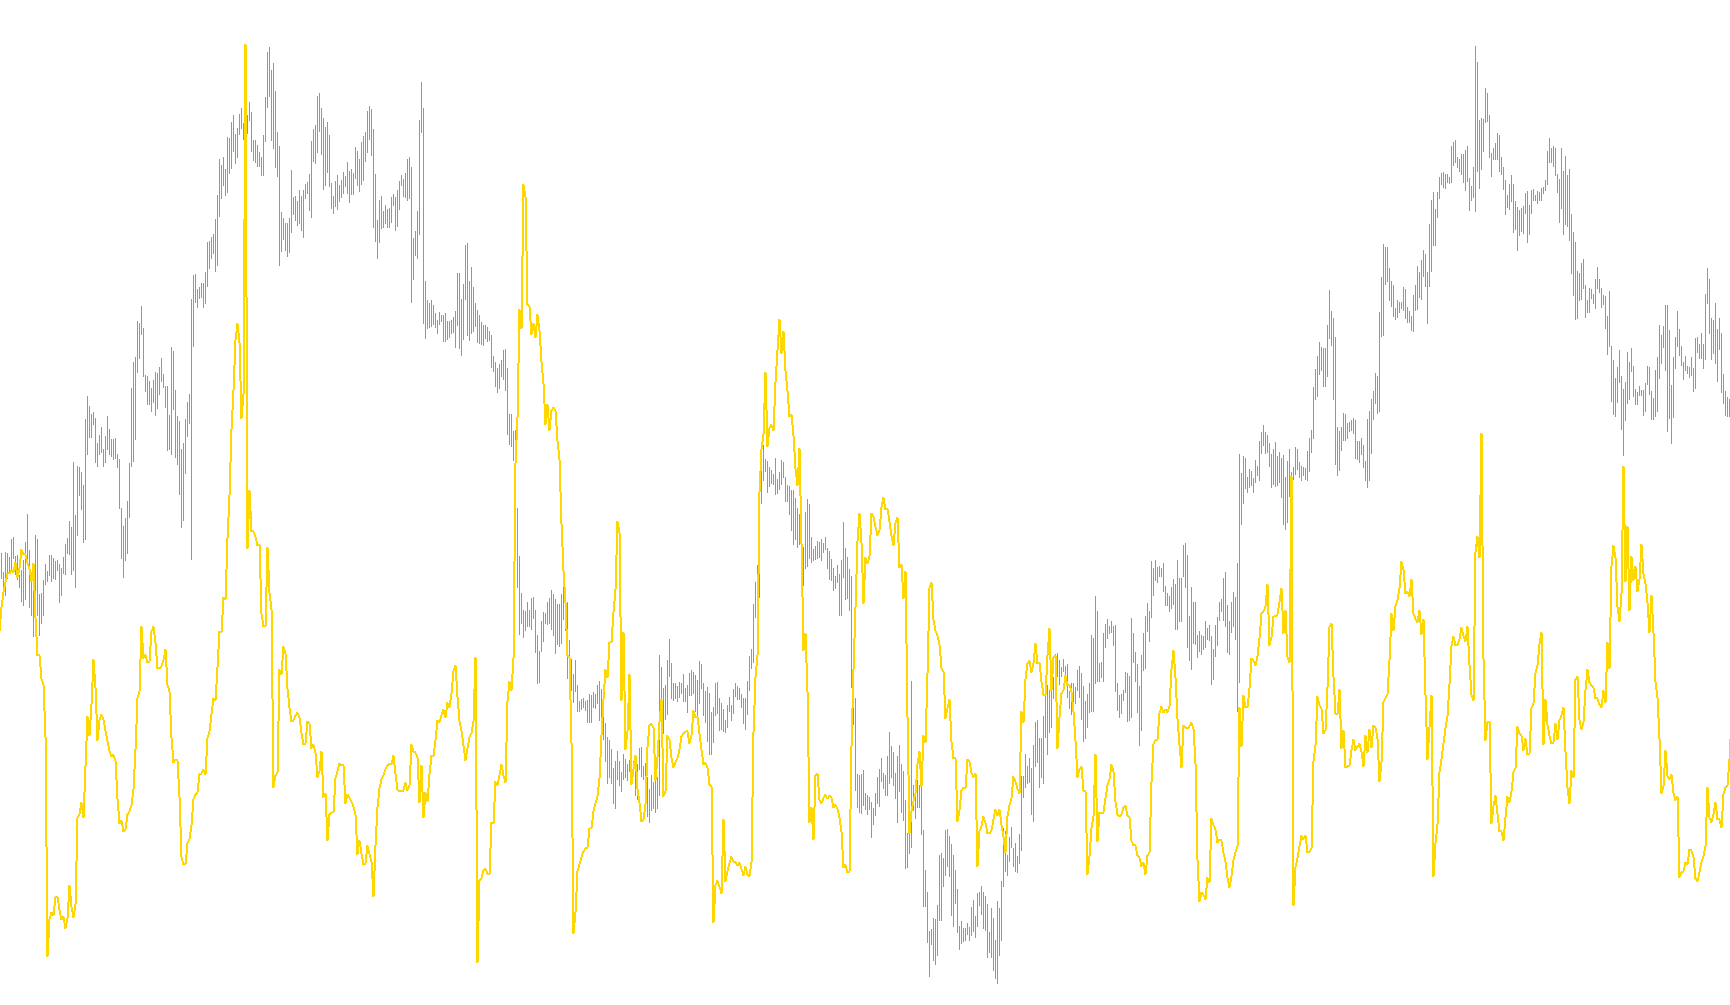
This tool is designed to provide traders with a visual representation of market volatility by calculating the relationship between the total price range and the sum of individual price movements over a specific timeframe.
How it Works
The logic behind this indicator focuses on identifying how "stretched" the price is compared to its usual behavior. It performs three main steps to reach this calculation:
1. Identifying the Price Range (The Extremes) The tool looks back at a specific number of previous candles (defined by the user, default is 28). Within this window, it identifies the absolute highest point reached and the absolute lowest point reached. By subtracting the lowest point from the highest, it determines the total "distance" traveled by the price during that period.
2. Measuring the Path (The Cumulative Movement) Instead of just looking at the start and end points, the tool examines every single individual movement (the change between one candle and the next) within that same timeframe. It adds up all these small movements to create a cumulative total of the price action.
3. Determining the Volatility Ratio Finally, the tool divides the "Total Distance" by the "Cumulative Movement."
What this means for the user
The resulting value shown on your chart represents a ratio:
- When the result is relatively low, it suggests that the price is moving in a steady, consistent manner.
- When the result spikes or changes significantly, it indicates that the price has moved a large distance over a very small number of movements—essentially highlighting periods of high intensity or significant market "stretch."
By visualizing this data as a line, you can better monitor whether current market movements are organic and sustained or if they are becoming abnormally erratic.
#property indicator_separate_window
#property indicator_buffers 1
#property indicator_color1 Yellow

//---- indicator parameters
extern int VHF_Period=28;

//---- indicator buffers
double ExtMapBuffer[];

//+------------------------------------------------------------------+
//| Custom indicator initialization function                         |
//+------------------------------------------------------------------+
int init()
  {

   SetIndexStyle(0,DRAW_LINE,STYLE_SOLID,2);
   SetIndexBuffer(0,ExtMapBuffer);

   return(0);
  }
//+------------------------------------------------------------------+
//|                                                                  |
//+------------------------------------------------------------------+
int start()
  {
   int limit;
   int counted_bars=IndicatorCounted();
   if(counted_bars<0) return(-1);
   if(counted_bars>0) counted_bars-=1;
   limit=Bars-counted_bars;

   for(int i=0; i<limit; i++)
   {
      ExtMapBuffer[i] = VHF(VHF_Period,i);
    }
    return(0);
  }


  double VHF(int period, int bar)
  {
      double HCP = High[Highest(NULL,0,MODE_CLOSE,period,bar)];
      double LCP = Low[Lowest(NULL,0,MODE_CLOSE,period,bar)];
      double Numerator = MathAbs(HCP-LCP);
      double Denominator ;

      for(int i=bar; i<bar+period; i++)
          Denominator = Denominator + MathAbs( Close [i] - Close[i+1]) ;

       return (Numerator/Denominator);
  }
Comments