VIDYA
Download script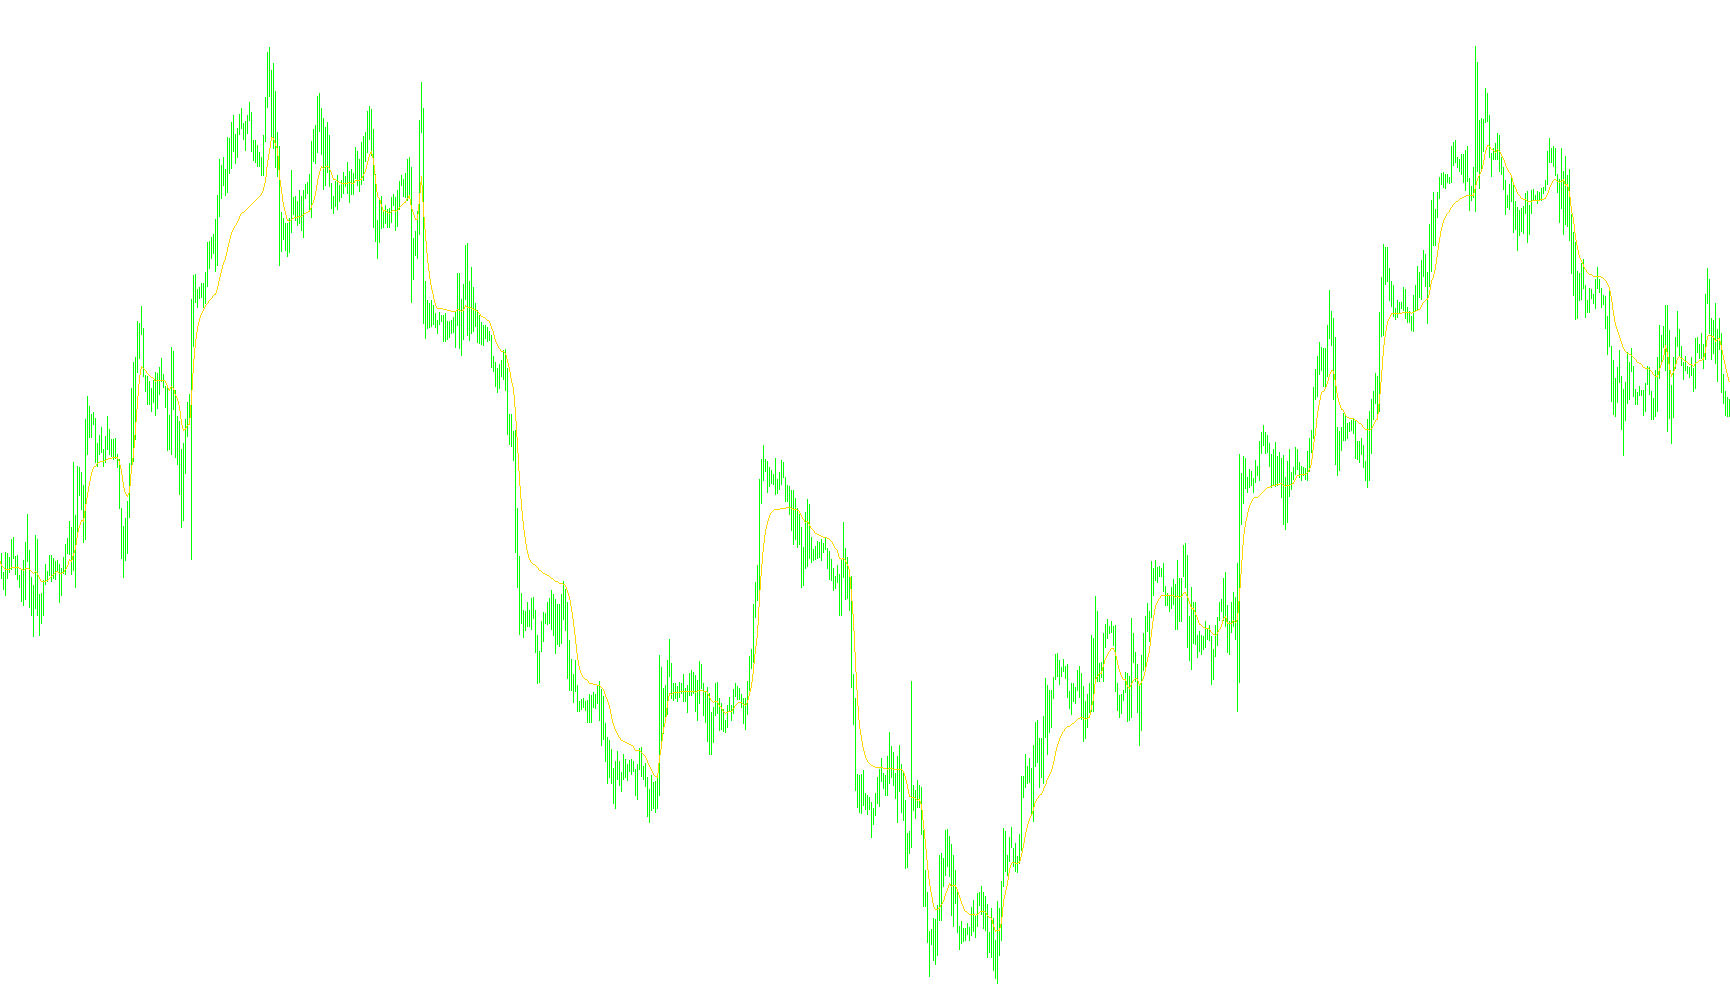
This tool is designed as a visual overlay for your trading charts, providing a smoothed representation of price action to help identify trends. Unlike standard moving averages that treat all historical data with equal importance, this specific logic uses a dynamic calculation to determine how much weight to give to recent price movements versus older data.
How the Logic Works
The script operates by analyzing two different layers of market volatility:
- Short-Term Volatility: It looks at a small, immediate window of time (defined by the "Period" setting) to see how much the price is swinging.
- Long-Term Volatility: It simultaneously looks at a much larger window of time (the "History Period") to understand the broader market context.
By comparing these two windows, the script calculates a "volatility ratio." This ratio tells the tool how aggressive the current market movement is relative to its historical norm.
The Calculation Process
Instead of simply averaging the price, the logic performs a multi-step calculation:
- Volatility Ratio: It divides the short-term volatility by the long-term volatility. A higher result indicates high immediate activity, while a lower result suggests a calmer market.
- Smoothing Factor: This ratio is then factored into a smoothing coefficient. This ensures that the resulting line doesn't jump erratically when the price makes sudden moves.
- Weighted Integration: Finally, the script calculates the current value by blending the current closing price with the previous value of the indicator. The "weight" of this blend is determined by the volatility ratio mentioned above.
Key Behavior for Traders
- Adaptability: Because the weight changes based on market conditions, the line reacts more quickly when volatility increases and becomes smoother and more stable during periods of low activity.
- Visual Representation: On your chart, this appears as a smooth blue line. It aims to filter out "market noise"—the tiny, insignificant ups and downs—to show you the underlying direction of the price.
- Stability: The script includes a built-in buffer that prevents the indicator from behaving unpredictably at the very edge of the current chart (the most recent live candle), ensuring it only calculates where there is enough historical data to be accurate.
Indicators Used
Miscellaneous
9
Views
0
Downloads
0
Favorites
VIDYA
//+------------------------------------------------------------------+
//|                                                         ARSI.mq4 |
//|                                     Copyright ?2009, Walter Choy |
//|                                                                  |
//+------------------------------------------------------------------+
#property copyright "Copyright ?2009, Walter Choy"
#property link      ""

#property indicator_chart_window
#property indicator_buffers 1
#property indicator_color1 Blue

//---- input parameters
extern int       period = 9;
extern int       histper = 30;

double VIDYA[];
//+------------------------------------------------------------------+
//| Custom indicator initialization function                         |
//+------------------------------------------------------------------+
int init()
  {
//---- indicators
   SetIndexStyle(0,DRAW_LINE);
   SetIndexBuffer(0,VIDYA);
   SetIndexLabel(0, "VIDYA");
   SetIndexDrawBegin(0, histper);
//----
   return(0);
  }
//+------------------------------------------------------------------+
//| Custom indicator deinitialization function                       |
//+------------------------------------------------------------------+
int deinit()
  {
//----

//----
   return(0);
  }
//+------------------------------------------------------------------+
//| Custom indicator iteration function                              |
//+------------------------------------------------------------------+
int start()
  {
   int    counted_bars=IndicatorCounted();
   int    i;
   double sc, k;
//----
   i = Bars - counted_bars;

   while (i>0){
      if (i < Bars - histper)
      {
         k =  iStdDev(NULL, 0, period, 0, MODE_SMA, PRICE_CLOSE, i) / iStdDev(NULL, 0, histper, 0, MODE_SMA, PRICE_CLOSE, i);
         sc = (2.0 / (period + 1));
         VIDYA[i] = k * sc * Close[i] + (1 - k * sc) * VIDYA[i+1];
      } else {
         VIDYA[i] = Close[i];
      }
      i--;
   }
//----
   return(0);
  }
//+------------------------------------------------------------------+
Comments