v35260_Colored
Download script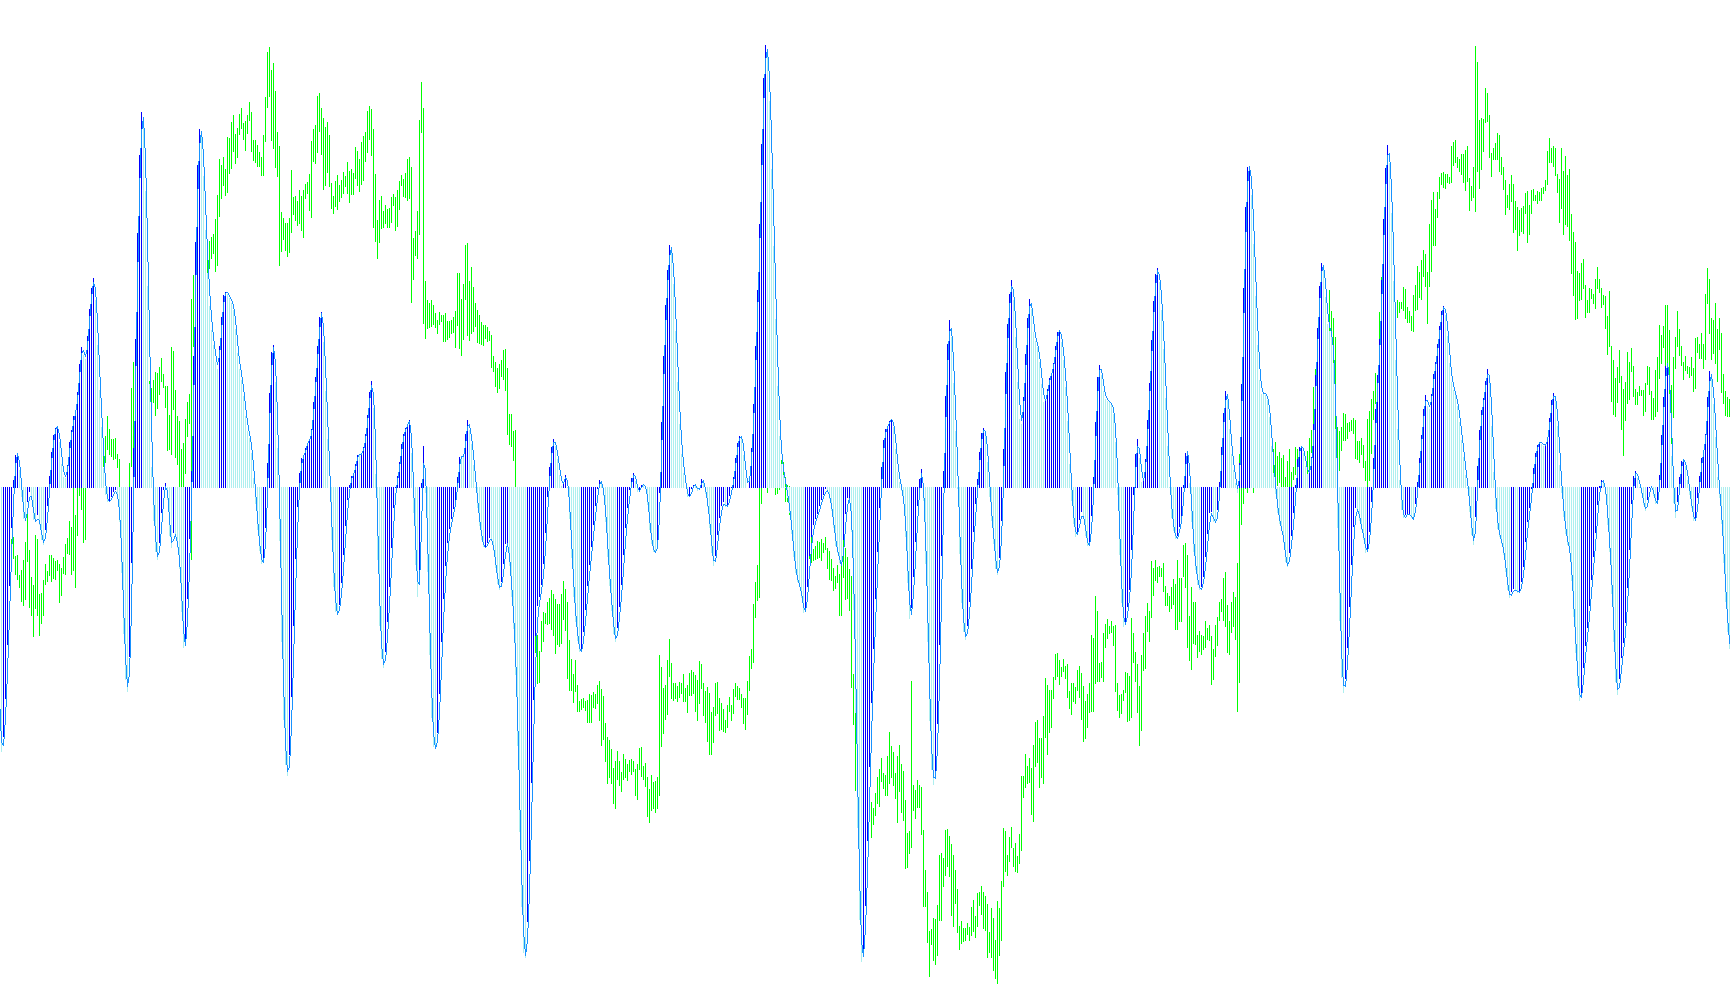
This tool is designed as a visual trading indicator for the MetaTrader platform. It serves to simplify market analysis by smoothing out price fluctuations and providing clear, actionable visual cues regarding momentum shifts.
Core Logic Overview
The script operates by processing underlying price data through several layers of calculation to identify trends while filtering out "market noise." Instead of looking at raw price changes, it utilizes a specialized moving average methodology (based on smoothed Heiken Ashi principles) to create a cleaner representation of market movement.
Key Components of the Logic:
-
Momentum Tracking: The tool calculates the difference between current and previous market values. By measuring this "gap," it determines the strength and direction of the immediate momentum. If the value is increasing, it suggests upward pressure; if decreasing, it suggests downward pressure.
-
Trend Identification (Dual Histogram): The indicator uses a sophisticated logic to separate price action into two distinct visual paths. When the market is moving in one direction, it highlights that specific movement. When the momentum shifts, the tool "switches" its focus, visually separating the two trends. This allows a trader to see where an upward trend ends and a downward trend begins at a glance.
-
Signal Smoothing: To prevent traders from reacting to minor, insignificant price wiggles, the script applies a "Signal Line." This is a secondary calculation that averages out the primary momentum data over a specific period. This helps identify the overall "health" of the trend rather than just the immediate tick-by-tick change.
How It Works for the User
The script provides a visual dashboard in a separate window on your chart. It interprets complex mathematical differences into three main visual elements:
- Directional Histograms: These show the active momentum, helping you see which direction the market is currently favoring.
- Trend Reversals: By comparing current values against previous ones, the tool automatically categorizes whether the price action is "rising" or "falling."
- Signal Line: This acts as a guide to confirm that the momentum shown by the histograms is significant enough to be considered a sustained trend change.
In summary, this tool functions as a trend-filtering system. It takes raw, erratic market data and transforms it into smoothed visual signals that highlight where the market is gaining strength and where it might be starting to pivot.
//+------------------------------------------------------------------+
//|                                                       v35260.mq4 |
//|                                                            IgorS |
//|                                            igor.senych@gmail.com |
//+------------------------------------------------------------------+
#property copyright "IgorS"
#property link      "igor.senych@gmail.com"


extern int MaMetod  = 3;
extern int MaPeriod = 5;
extern int MaMetod2  = 3;
extern int MaPeriod2 = 8;

extern int Signal=2;

extern bool main = true;

int bufer = 0;
//---- indicator settings
#property  indicator_separate_window
#property  indicator_buffers 4
#property  indicator_color1  Black
#property  indicator_color2  Purple
#property  indicator_color3  DarkOrange
#property  indicator_color4  Red
#property  indicator_width2  2
#property  indicator_width3  2

//---- indicator buffers
double     ExtBuffer0[];
double     ExtBuffer1[];
double     ExtBuffer2[];
double     ExtBuffer3[];

//+------------------------------------------------------------------+
//| Custom indicator initialization function                         |
//+------------------------------------------------------------------+
int init()
  {
   //---- drawing settings
   SetIndexStyle(0,DRAW_NONE);
   SetIndexStyle(1,DRAW_HISTOGRAM);
   SetIndexStyle(2,DRAW_HISTOGRAM);
   SetIndexStyle(3,DRAW_LINE);
   IndicatorDigits(Digits+1);
//---- 4 indicator buffers mapping
   SetIndexBuffer(0,ExtBuffer0);
   SetIndexBuffer(1,ExtBuffer1);
   SetIndexBuffer(2,ExtBuffer2);
   SetIndexBuffer(3,ExtBuffer3);
//---- name for DataWindow and indicator subwindow label
   IndicatorShortName("v35260");
   SetIndexLabel(1,"sdo");
   SetIndexLabel(2,"sdo");
   SetIndexLabel(3,"Signal");

   if(main == true) bufer = 3;
   else bufer = 1;
//---- initialization done
   return(0);
  }
//+------------------------------------------------------------------+
//| Awesome Oscillator                                               |
//+------------------------------------------------------------------+
int start()
  {
   int    limit;
   int    counted_bars=IndicatorCounted();
   double prev,current;
//---- last counted bar will be recounted
   if(counted_bars>0) counted_bars--;
   limit=Bars-counted_bars;
//---- macd
   for(int i=0; i<limit; i++)
      ExtBuffer0[i]=iCustom(Symbol(),0,"Heiken_Ashi_Smoothed",MaMetod,MaPeriod,MaMetod2,MaPeriod2,bufer,i)-iCustom(Symbol(),0,"Heiken_Ashi_Smoothed",MaMetod,MaPeriod,MaMetod2,MaPeriod2,bufer-1,i);
//---- dispatch values between 2 buffers
   bool up=true;
   for(i=limit-1; i>=0; i--)
     {
      current=ExtBuffer0[i];
      prev=ExtBuffer0[i+1];
      if(current>prev) up=true;
      if(current<prev) up=false;
      if(!up)
        {
         ExtBuffer2[i]=current;
         ExtBuffer1[i]=0.0;
        }
      else
        {
         ExtBuffer1[i]=current;
         ExtBuffer2[i]=0.0;
        }
     }
//---- signal line
   for(i=0; i<limit; i++)
      ExtBuffer3[i]=iMAOnArray(ExtBuffer0,Bars,Signal,0,MODE_SMA,i);
//---- done
   return(0);
  }
//+------------------------------------------------------------------+
Comments