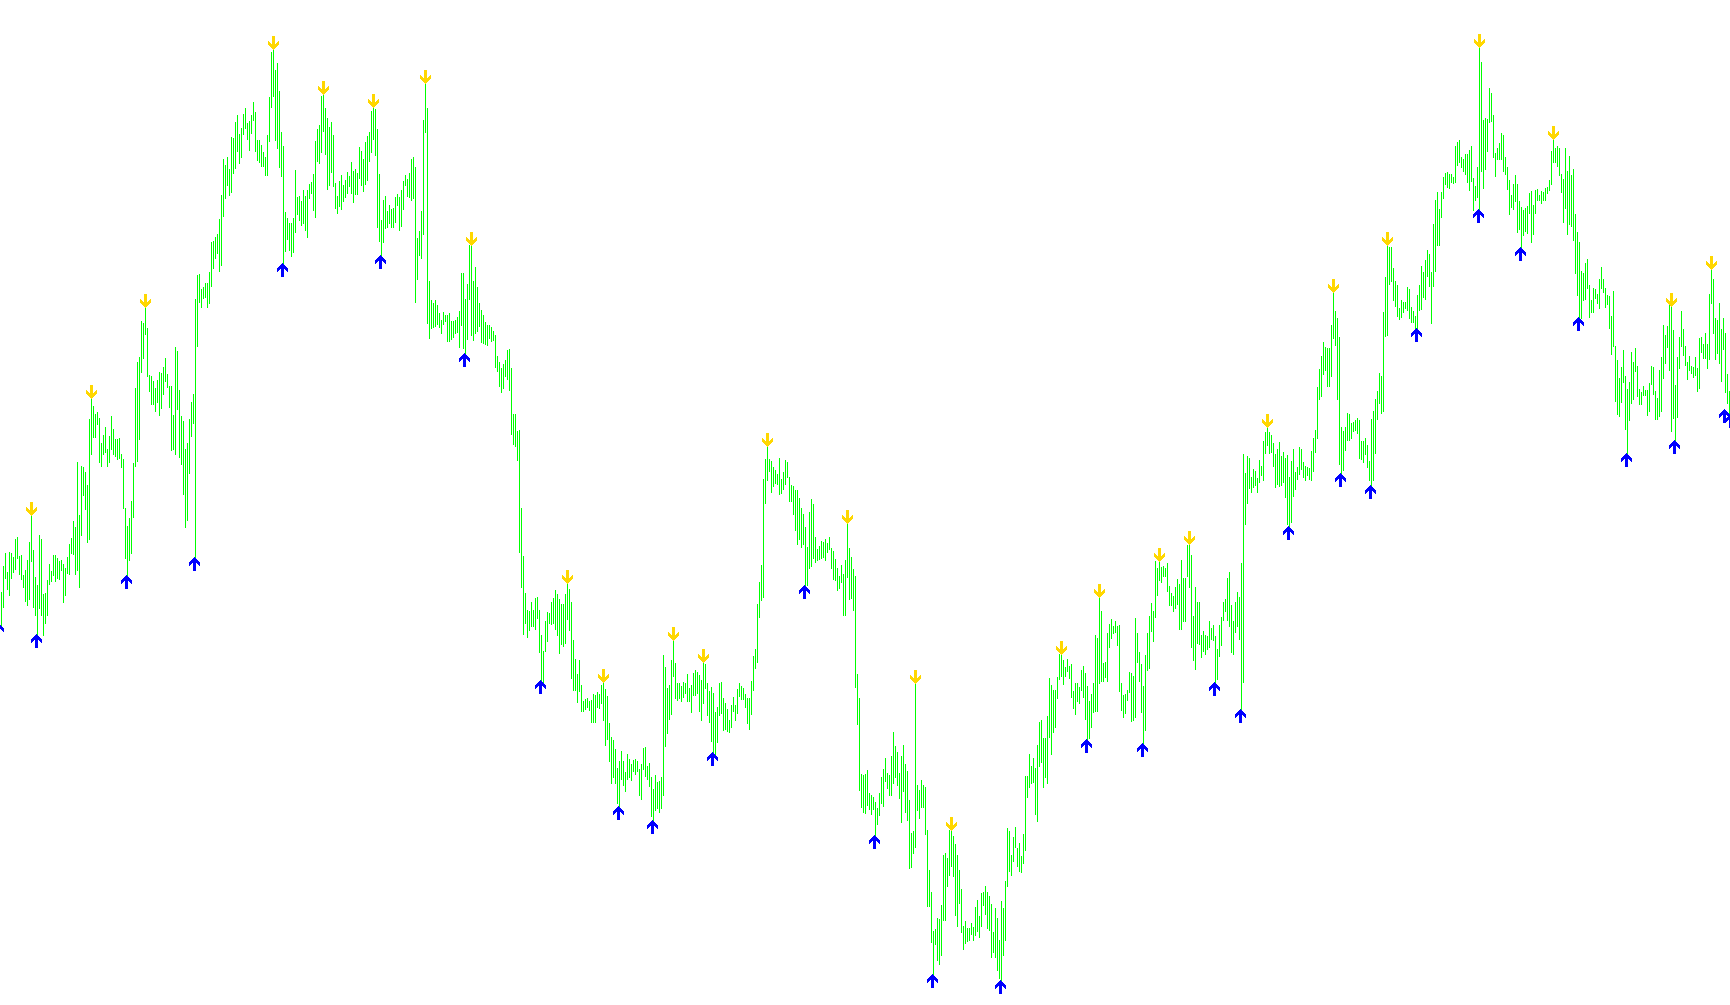
This tool is designed to provide visual guidance on a trading chart by identifying specific price action milestones. Rather than following complex mathematical formulas, it focuses on recognizing the highest peaks and lowest valleys within a rolling window of recent price movement.
How the Logic Works
The script constantly scans the history of the market to identify "extremes." It looks at a specific set of previous bars (a defined range) to determine where the highest point and the lowest point occurred during that period.
- Identifying Peaks: The system searches for the highest price reached within a designated look-back window. When it finds this peak, it places a visual marker directly above it.
- Identifying Valleys: Simultaneously, the system searches for the lowest price reached within that same window. When it identifies this valley, it places a visual marker directly below it.
- Visual Positioning: To ensure these markers are clearly visible and do not overlap with the actual candles or price lines, the script automatically offsets them slightly above the high and below the low.
Summary of Behavior
Think of this indicator as an automated "highlighter." It moves along the chart, constantly checking a rolling section of data to point out where the price hit its ceiling and its floor. By doing this, it helps traders quickly visualize the significant structural boundaries of the market without having to manually hunt for the highest or lowest points in a volatile trend.
//+------------------------------------------------------------------+
//|                                                super-signals.mq4 |
//|                Copyright © 2006, Nick Bilak, beluck[AT]gmail.com |
//+------------------------------------------------------------------+
#property copyright "Copyright © 2006, Nick Bilak"
#property link      "http://www.forex-tsd.com/"

#property indicator_chart_window
#property indicator_buffers 2
#property indicator_color1 Red
#property indicator_color2 Aqua

extern int SignalGap = 10;

int dist=24;
double b1[];
double b2[];

int init()  {
   SetIndexStyle(0,DRAW_ARROW,STYLE_SOLID,1);
   SetIndexStyle(1,DRAW_ARROW,STYLE_SOLID,1);
   SetIndexArrow(1,233);
   SetIndexArrow(0,234);
   SetIndexBuffer(0,b1);
   SetIndexBuffer(1,b2);
   return(0);
}
int start() {
   int counted_bars=IndicatorCounted();
   int k,i,j,limit,hhb,llb;

   if (counted_bars<0) return(-1);
   if (counted_bars>0) counted_bars--;
   limit=Bars-1;
   if(counted_bars>=1) limit=Bars-counted_bars-1;
   if (limit<0) limit=0;

   for (i=limit;i>=0;i--)   {
      hhb = Highest(NULL,0,MODE_HIGH,dist,i-dist/2);
      llb = Lowest(NULL,0,MODE_LOW,dist,i-dist/2);

      if (i==hhb)
         b1[i]=High[hhb]+SignalGap*Point;
      if (i==llb)
         b2[i]=Low[llb]-SignalGap*Point;
   }
   return(0);
}
Comments