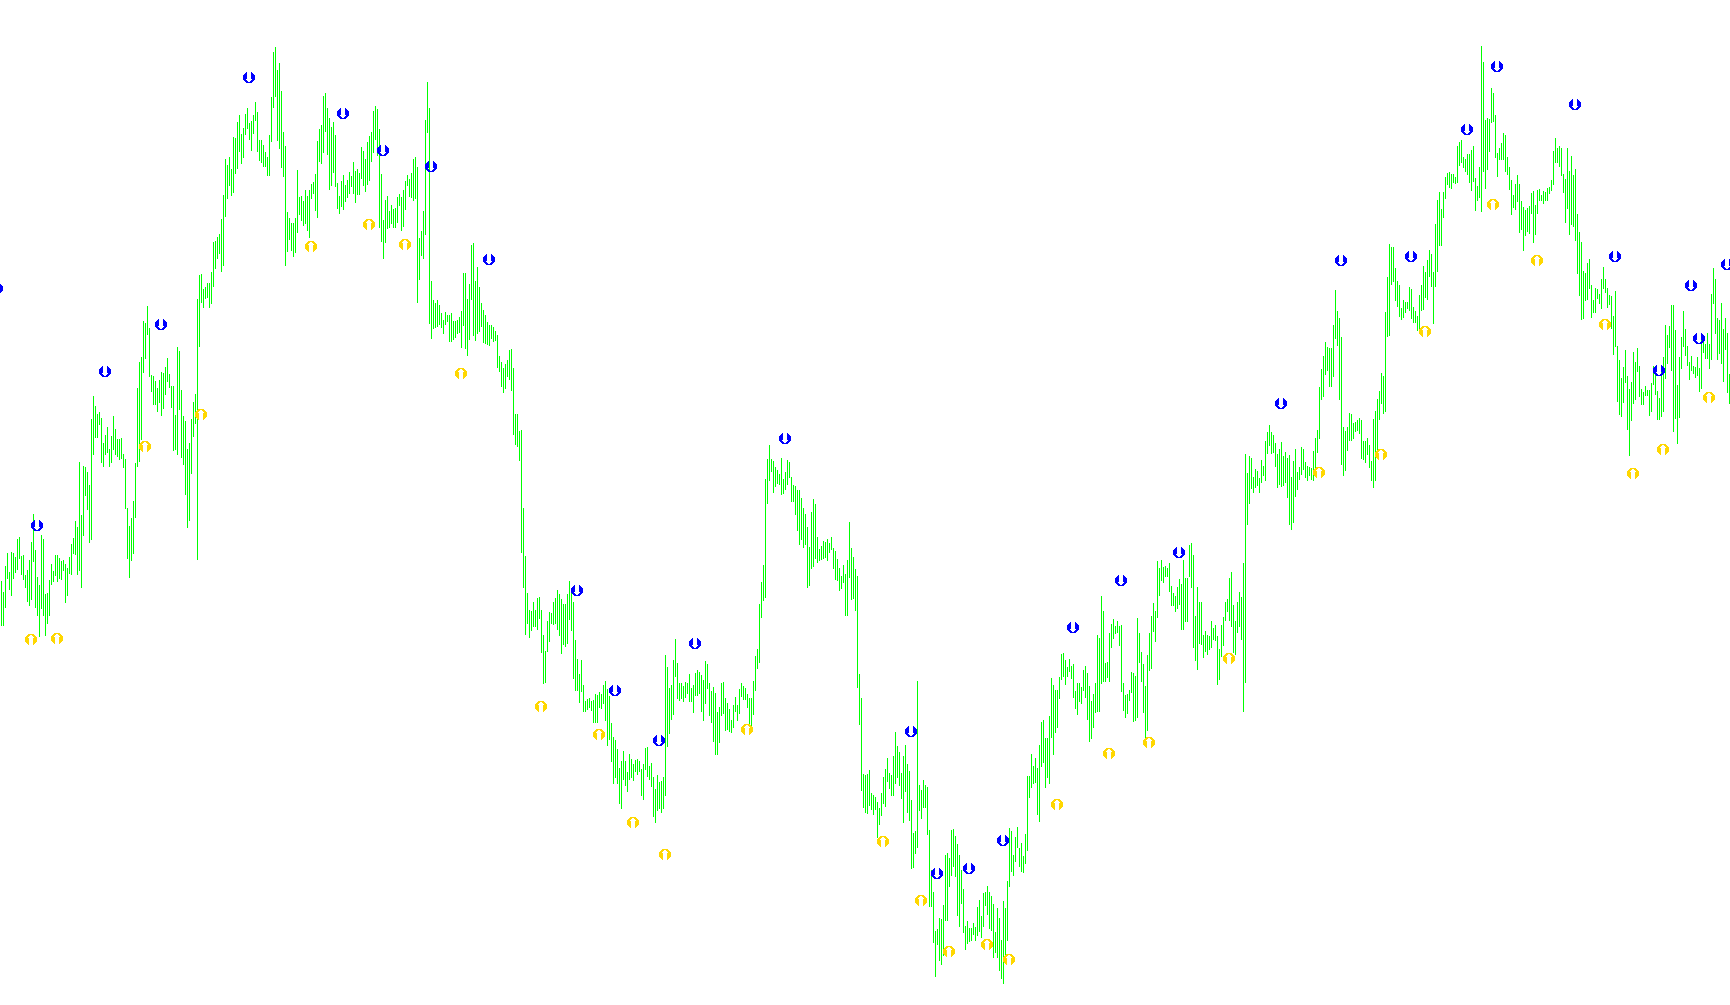
StepMA_v7.2
Indicator

StepMA_v7.2

This indicator identifies price trajectory by calculating a discrete step-based moving average that adjusts its volatility sensitivity to filter market noise and visually delineate trend reversals.

StepMA_v7.2_002
Indicator

StepMA_v7.2_002

This indicator generates a quantized price progression by calculating dynamic vertical steps based on historical volatility and high/low extremes to identify structural trend shifts.

StepMA_v7.2_003
Indicator

StepMA_v7.2_003

This indicator calculates a staircase-style moving average that adjusts its vertical displacement based on real-time price range volatility and trend direction.

StepMA_v7.2_004
Indicator

StepMA_v7.2_004

A trend-following indicator that utilizes price action breakouts and ATR-derived volatility scaling to generate quantized, stair-step price levels.

StepMA_v7
Indicator

StepMA_v7

This indicator calculates a quantized price trajectory by determining dynamic step sizes based on average range volatility and applying trend-dependent price boundaries.

StepMA_v7a
Indicator

StepMA_v7a

iMA

This indicator utilizes Keltner Channel logic and volatility-adjusted step calculations to create a responsive trend-following moving average that identifies structural price shifts.

StepMA_v7a_v1
Indicator

StepMA_v7a_v1

iMA

This indicator calculates a staircase-style moving average by dynamically adjusting step sizes based on Keltner Channel volatility and price position relative to the range.

StepMA_v7EA
Indicator

StepMA_v7EA

This indicator tracks market direction by establishing price boundaries based on weighted average ranges and dynamic step increments to filter out minor noise.

StepMA_v7[1].1
Indicator

StepMA_v7[1].1

This indicator generates a staircase-style trend line by calculating price movement thresholds based on the relative range of historical volatility.

StepMA_v7_002
Indicator

StepMA_v7_002

This indicator tracks price action by creating a discrete, staircase-like movement that filters market noise through volatility-adjusted step thresholds and trend-switching logic.

StepMA_v7_v1
Indicator

StepMA_v7_v1

This indicator constructs a quantized price trend by calculating discrete step values based on ATR-derived volatility and price breakout detection.

StepMA_v7_v2
Indicator

StepMA_v7_v2

This indicator identifies trend momentum by constructing a discrete price staircase that adjusts its step height based on historical volatility ranges.

StepRSI_v2 with Alert
Indicator

StepRSI_v2 with Alert

iRSI

This indicator identifies potential trend reversals by detecting crossover events between dynamically stepped RSI boundaries of varying sensitivities.

StepRSI_v2
Indicator

StepRSI_v2

iRSI

This indicator overlays dual-layered trailing boundaries onto the RSI values to identify sustained momentum shifts and potential trend exhaustion levels.

StepRSI_v2_v1
Indicator

StepRSI_v2_v1

iRSI

This indicator tracks Relative Strength Index trends by utilizing multi-layered step boundaries to filter noise and identify sustained directional momentum shifts.

StepRSI_v2_v2
Indicator

StepRSI_v2_v2

iRSI

This indicator quantifies momentum by mapping Relative Strength Index values into dynamic multi-level step boundaries to visualize trend exhaustion and structural shifts.

StepRSI_v5.2
Indicator

StepRSI_v5.2

iMAiRSI

This indicator applies a staircase-style quantization to relative strength values, identifying significant structural shifts in price velocity while filtering out minor volatility noise.

StepRSI_v5.2_v1
Indicator

StepRSI_v5.2_v1

iMAiRSI

This indicator synthesizes Relative Strength Index calculations with a step-based trend filter to identify discrete structural shifts in price momentum.

StepRSI_v5.2_v2
Indicator

StepRSI_v5.2_v2

iMAiRSI

This indicator quantifies momentum relative strength and applies a stepped volatility buffer to isolate significant trend reversals from minor price fluctuations.

StepSto_v1
Indicator

StepSto_v1

iATR

This indicator quantifies market momentum by normalizing price breakouts against volatility-adjusted step boundaries derived from Average True Range extremes.

StepSto_v1_v1
Indicator

StepSto_v1_v1

iATR

This indicator identifies market regimes by calculating volatility-adjusted price boundaries and normalizing their trend deviations into a dual-line oscillator.

StepSto_v1_v2
Indicator

StepSto_v1_v2

iATR

This indicator calculates momentum by dynamically scaling price step boundaries using Average True Range volatility to determine trend strength and relative position.

StepSto_v1_v3
Indicator

StepSto_v1_v3

iATR

This indicator calculates momentum by normalizing price action against dynamic volatility bands derived from Average True Range (ATR) to identify trend intensity and reversal thresholds.

StepSto_v2
Indicator

StepSto_v2

This indicator quantifies trend momentum by calculating normalized price deviations relative to ATR-based volatility steps.

Step_MA_4_Hour_EJandGJ
Indicator

Step_MA_4_Hour_EJandGJ

This indicator calculates a stepped momentum profile based on Weighted Average True Range (WATR) to identify structural trend shifts and provide crossover signals.

STik
Indicator

STik

The logic identifies identical price coordinates within a high-frequency binary tick archive to map historical price occurrences and visualize repeated price levels.

STLM2
Indicator

STLM2

This indicator calculates the difference between two distinct multi-period weighted price sums to identify directional momentum shifts via a histogram.

STLM2_002
Indicator

STLM2_002

The indicator calculates two distinct weighted moving averages using fixed coefficients to determine momentum direction and intensity via a histogram.

STLM2_v1
Indicator

STLM2_v1

This indicator calculates the delta between two distinct weighted price summations over a 90-bar period to identify directional momentum shifts.

STLM2_v2
Indicator

STLM2_v2

This indicator calculates a directional bias by comparing two distinct weighted moving averages of historical closing prices to identify bullish and bearish momentum shifts.

Indicator

STLMs

Indicator

STLMs_v1

STLM_hist
Indicator

STLM_hist

The indicator calculates the divergence between two distinct linear regression weight models over a 90-period window to identify directional momentum shifts.

STLM_hist_v1
Indicator

STLM_hist_v1

This indicator calculates momentum by applying a multi-period linear weighting coefficient to historical close prices to determine directional trend strength.

STLM_hist_v2
Indicator

STLM_hist_v2

This indicator utilizes a complex weighted summation of historical closing prices to calculate and visualize momentum shifts through a dual-histogram comparison.

Indicator

StocasticsOnPriceChart

iStochastic
Indicator

StocasticsOnPriceChart1

iStochastic
Indicator

StocasticsOnPriceChart1_v1

iStochastic
Indicator

StocasticsOnPriceChartExtreme

iStochastic
Indicator

StocasticsOnPriceChartExtreme_v1

iStochastic
Indicator

StocasticsOnPriceChart_v1

iStochastic
Indicator

StocasticsOnPriceChart_v2

iStochastic
Stoch Crossing
Indicator

Stoch Crossing

iStochastic

This indicator identifies trend reversals by detecting specific bullish and bearish crossovers between the %K and %D lines of the Stochastic Oscillator.

Stoch Crossing_001
Indicator

Stoch Crossing_001

iStochastic

This indicator identifies precise bullish and bearish entries by detecting the intersection of Stochastic %K and %D lines while filtering for momentum shifts via real-time price range calculations.

Indicator

Stoch Crossing_Pivot

iStochastic
Stoch Crossing_v2
Indicator

Stoch Crossing_v2

iStochastic

This indicator identifies precise bullish and bearish entry points by detecting the instantaneous intersection of the Stochastic %K and %D lines across multi-period dynamics.

Indicator

STOCHALERT

iStochastic
Indicator

STOCHALERT_v1

iStochastic
Stochastic 2,3,3
Indicator

Stochastic 2,3,3

iMAOnArray

This algorithm calculates a percentage-based momentum value by comparing the relative position of recent closing prices within a defined high-low price range.

Stochastic 21,9,9
Indicator

Stochastic 21,9,9

iMAOnArray

Calculates the relative position of current prices within a defined price range to identify overbought and oversold momentum shifts.