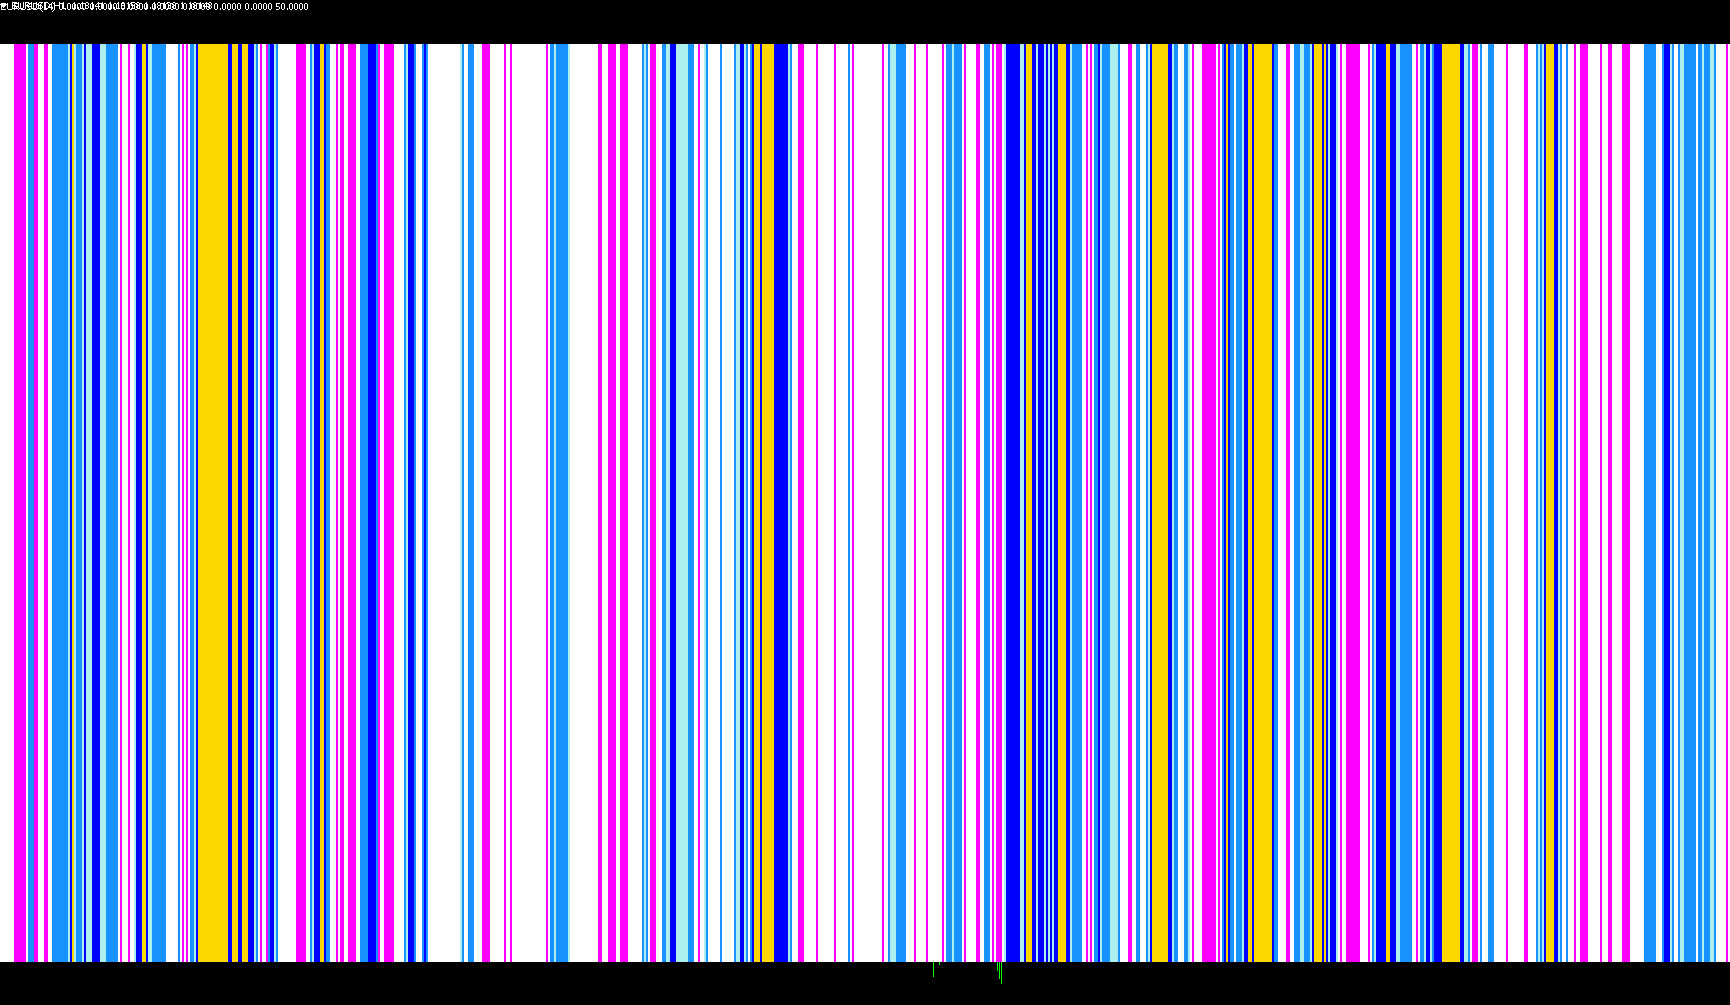
This tool is a visual market analysis indicator designed for the MetaTrader platform. It provides traders with a color-coded histogram that monitors momentum and price action, helping to identify different market states such as overbought, oversold, or ranging conditions at a glance.
Core Functionality
The script operates by calculating specific mathematical values based on the current market data. While it is configured to use a specific set of logic, it allows for flexibility in how these calculations are performed and displayed:
- Dynamic Multi-Symbol Monitoring: The tool can be set to monitor the current currency pair you are viewing or a specific pair entered manually by the user (e.g., EURUSD).
- Momentum Analysis: It uses momentum oscillators to determine the "strength" of price movements. It provides two different modes for this calculation, allowing the user to choose between the main data line or a smoothed signal line.
- Inversion Toggle: There is a built-in feature to invert the strength of the data. This allows traders to flip the visual logic to suit different trading styles or specific market personalities.
Visual Logic & Color Coding
The primary purpose of this script is to transform complex numbers into a color-coded visual system. Instead of just showing a single line, it uses eight different color buffers to create a layered histogram.
The logic interprets the calculated momentum values against specific thresholds:
- High Intensity (Top Tiers): When the market shows high positive momentum, specific colors are triggered to highlight the "strength" levels (e.g., levels above 70, 80, and 90).
- Neutral/Ranging Zones: The script identifies middle-ground values to signal when the market is neither strongly trending up nor down.
- Low Intensity (Bottom Tiers): When momentum drops into lower percentages (e.g., levels below 30, 20, and 10), different colors appear to alert the trader to potential exhaustion or reversal zones.
User Customization
The script is designed to be highly adjustable via a settings menu without requiring any code knowledge:
- Sensitivity: Users can adjust the period and smoothing of the calculations to make the indicator more reactive or more stable.
- Visual Scaling: A "Bar Level" setting allows users to adjust the physical height of the blocks on the chart, ensuring the histogram fits perfectly within their workspace.
- Labeling: The tool can automatically display text labels on the chart to help identify which specific threshold is being triggered at any given moment.
//+------------------------------------------------------------------+
//|                                     multisymbol_color-RSI_1.0.mq4|
//|                                                      Lq_sunshine |
//|                                         http://www.forex-tsd.com |
//+------------------------------------------------------------------+
//mod.  barlevel sto    ki


#property indicator_separate_window
#property indicator_buffers 8


#property indicator_color1 Blue           //C'29,165,29'   //dark green
#property indicator_color2 DodgerBlue     //C'73,204,70'
#property indicator_color3 DarkTurquoise  //C'140,240,130'
#property indicator_color4 Aquamarine     //C'188,253,176' //lite green
#property indicator_color5 Yellow         //C'255,185,185' //lite red
#property indicator_color6 Orange         //C'255,115,115'
#property indicator_color7 Red            //C'255,76,76'
#property indicator_color8 Maroon         //C'255,32,32'   //red


#property indicator_maximum 77
#property indicator_minimum 1


//extern int    Periode=14;
extern int Periode=14;
extern int PercentD=3;
extern int Smooth=3;
extern bool  StoModeK = true;

extern bool   invert_strength =  0;
extern string CurrencyPair    = "";
extern bool  lablesOn = true;
extern int   BarLevel= 10;

extern string NOTE_1    = "enter currencypair in uppercase";
extern string ______    = "like EURUSD";
extern string _____     = "leave empty for current symbol";
extern string NOTE_2    = "if you have a mini account";
extern string ___       = "add a \"m\"  e.g EURUSDm ";

//---- buffers
   double     ExtBuffer0[];
   double     ExtBuffer1[];
   double     ExtBuffer2[];
   double     ExtBuffer3[];
   double     ExtBuffer4[];
   double     ExtBuffer5[];
   double     ExtBuffer6[];
   double     ExtBuffer7[];
   double     ExtBuffer8[];


//+------------------------------------------------------------------+
//+------------------------------------------------------------------+
int init()
{
   SetIndexBuffer(0,ExtBuffer0);
   SetIndexBuffer(1,ExtBuffer1);
   SetIndexBuffer(2,ExtBuffer2);
   SetIndexBuffer(3,ExtBuffer3);
   SetIndexBuffer(4,ExtBuffer4);
   SetIndexBuffer(5,ExtBuffer5);
   SetIndexBuffer(6,ExtBuffer6);
   SetIndexBuffer(7,ExtBuffer7);

   SetIndexStyle(0,DRAW_HISTOGRAM, EMPTY, 5);
   SetIndexStyle(1,DRAW_HISTOGRAM, EMPTY, 5);
   SetIndexStyle(2,DRAW_HISTOGRAM, EMPTY, 5);
   SetIndexStyle(3,DRAW_HISTOGRAM, EMPTY, 5);
   SetIndexStyle(4,DRAW_HISTOGRAM, EMPTY, 5);
   SetIndexStyle(5,DRAW_HISTOGRAM, EMPTY, 5);
   SetIndexStyle(6,DRAW_HISTOGRAM, EMPTY, 5);
   SetIndexStyle(7,DRAW_HISTOGRAM, EMPTY, 5);

   for (int i=0;i<indicator_buffers;i++) SetIndexLabel(i,NULL);

   if (CurrencyPair == "") CurrencyPair = Symbol();
   if (iClose(CurrencyPair,0,0) == 0)
              CurrencyPair = Symbol();

   IndicatorShortName(CurrencyPair+"("+Periode+")");

if (lablesOn)
 {
 SetIndexLabel(0,">90");   //litegreen
 SetIndexLabel(1,"<90");
 SetIndexLabel(2,"<80");
 SetIndexLabel(3,"<70");   //green
 SetIndexLabel(4,"<50");   //litered
 SetIndexLabel(5,"<30");
 SetIndexLabel(6,"<20");
 SetIndexLabel(7,"<10");   //red
 }


   return(1);
}

int deinit()
  {
   return(0);
  }
//+------------------------------------------------------------------+
//+------------------------------------------------------------------+
int start()
  {


   int    counted_bars=IndicatorCounted();

//---- check for possible errors
   if (counted_bars<0) return(-1);
//---- last counted bar will be recounted
   if (counted_bars>0) counted_bars--;

   int    pos=Bars-counted_bars;


  double ddraw;

// double level[];

//---- main calculation loop
   while(pos>=0)
   {
//   ddraw= iRSI(CurrencyPair,0,Periode,PRICE_CLOSE,pos);
double   PK=iStochastic(NULL, 0,Periode,PercentD,Smooth,0,0,MODE_MAIN,pos);
double   PD=iStochastic(NULL, 0,Periode,PercentD,Smooth,0,0,MODE_SIGNAL,pos);

   if (StoModeK) ddraw=PK; else ddraw=PD;

         if (invert_strength==1)
             ddraw=ddraw-(ddraw-50)*2;             //---- Inversion of the RSI

         if(ddraw<100)           //---- RSI <= 48 draws RED blocks
            drawblock(5,0,0,0,0,0,0,0,pos);

              if(ddraw<90)    //---- 44< RSI  draws RED blocks
                drawblock(0,5,0,0,0,0,0,0,pos);

                   if(ddraw<80)  //---- 39< RSI  draws RED blocks
                          drawblock(0,0,5,0,0,0,0,0,pos);

                          if(ddraw<70)//---- 35< RSI  draws RED blocks
                                drawblock(0,0,0,5,0,0,0,0,pos);


           if(ddraw<50)//---- RSI >= 52 <56 draws green blocks
                  drawblock(0,0,0,0,5,0,0,0,pos);

               if(ddraw<30)//---- RSI >= 56 <60 draws green blocks
                      drawblock(0,0,0,0,0,5,0,0,pos);

                   if(ddraw<20)//---- 60>RSI<70 draws green blocks
                         drawblock(0,0,0,0,0,0,5,0,pos);

                      if(ddraw<10)
                           drawblock(0,0,0,0,0,0,0,5,pos);     //---- draw white block if there chart is ranging
//


         pos--;
   }


//----
   return(0);
  }

void drawblock(int a,int b,int c,int d,int e,int f,int g,int h,int pos)

{

               ExtBuffer0[pos]=a*BarLevel;
               ExtBuffer1[pos]=b*BarLevel;
               ExtBuffer2[pos]=c*BarLevel;
               ExtBuffer3[pos]=d*BarLevel;
               ExtBuffer4[pos]=e*BarLevel;
               ExtBuffer5[pos]=f*BarLevel;
               ExtBuffer6[pos]=g*BarLevel;
               ExtBuffer7[pos]=h*BarLevel;


}
Comments