This script is designed to automatically identify and highlight potential areas of support and resistance on a price chart. These areas are found by looking for "fractals," which are specific price patterns that suggest potential turning points in the market.
Here's a breakdown:
-
Setup:
- The script starts by defining two customizable inputs:
- NumberOfSupDem: This determines how many support and resistance zones the script will try to identify and display. The script draws multiple support and resistance areas, it draws the 'n' near support and resistance areas
- TopColor & BotColor: These allow you to choose the colors used to draw the resistance (TopColor) and support (BotColor) zones on the chart.
- The script starts by defining two customizable inputs:
-
Finding Fractals:
- The core of the script involves finding fractals. A fractal is a price pattern that often signals a potential reversal in the market trend. The script uses a built-in function to locate these fractals. It uses the 'n' near fractals to draw the support and resistance areas, the user can configure this 'n' number.
- It looks for two types of fractals:
- Upper Fractals: These suggest potential areas of resistance, where the price might struggle to move higher.
- Lower Fractals: These suggest potential areas of support, where the price might find it difficult to fall lower.
- The fractals are found using the current symbol and a timeframe between the current chart or the daily chart
-
Drawing Support and Resistance Zones:
- Once a fractal is found, the script draws a rectangular zone around it.
- The script draws two types of zone:
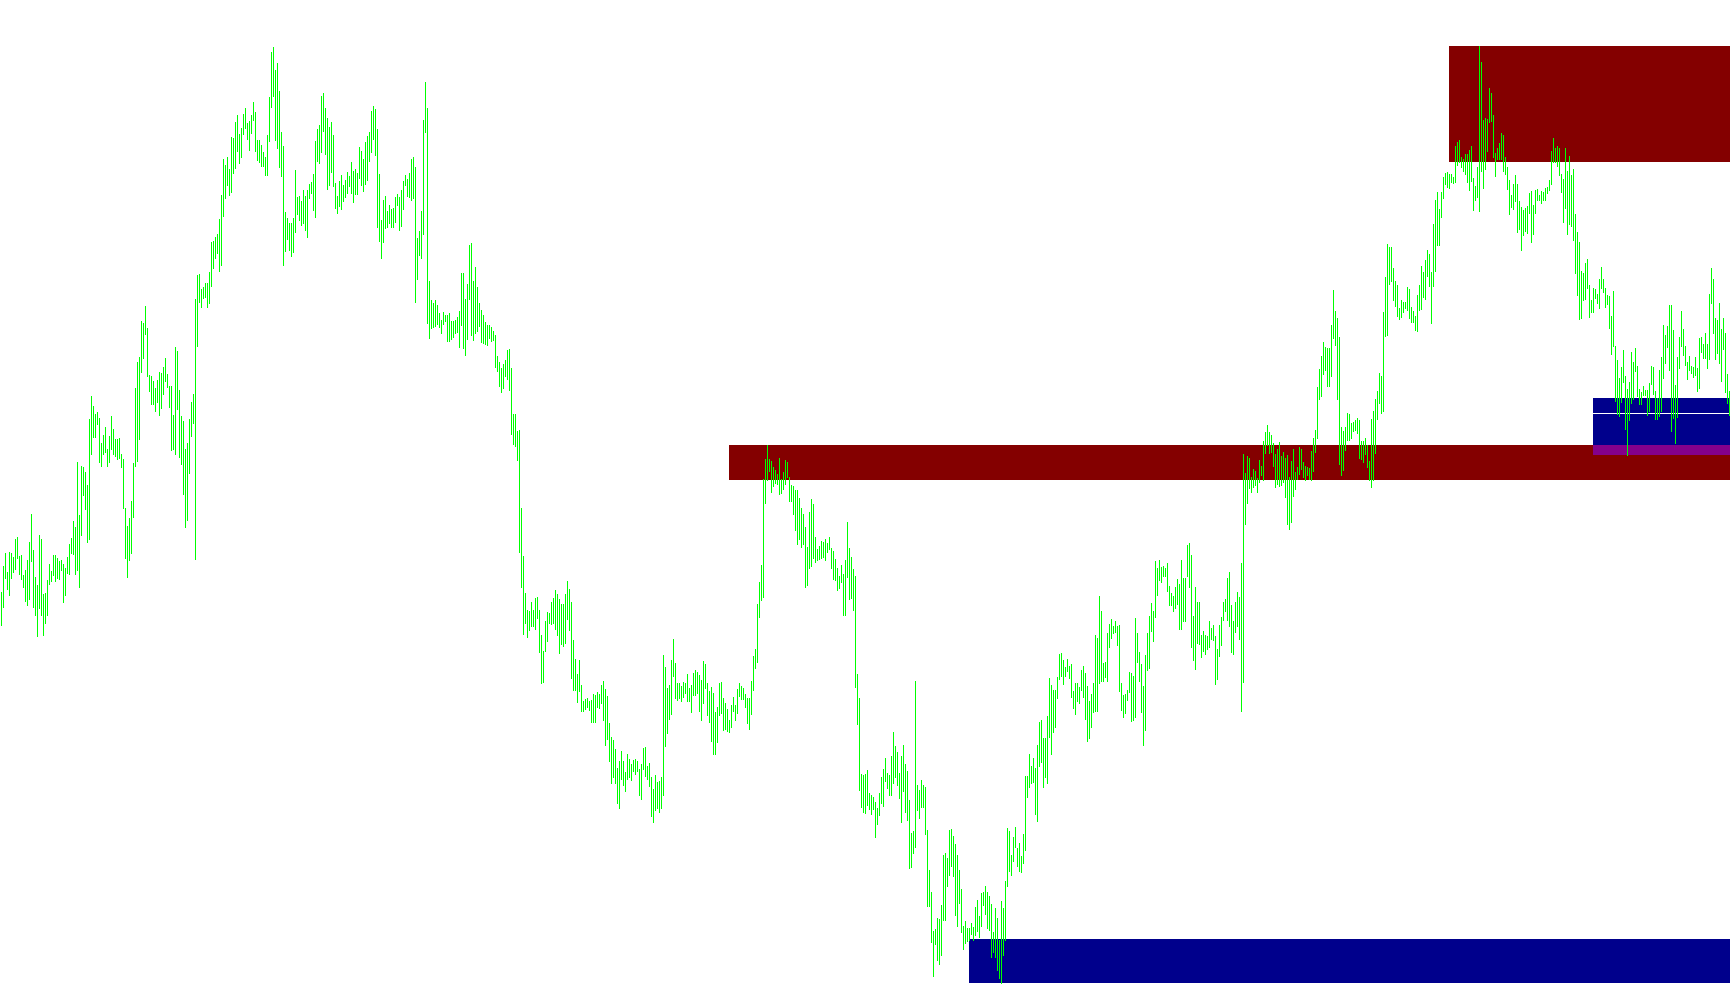
- Support Zones: Drawn at lower fractals using a color specified by the user.
- Resistance Zones: Drawn at upper fractals using a color specified by the user.
- These zones visually represent areas where the price has previously shown a tendency to either bounce upwards (support) or be turned back downwards (resistance).
-
Updating Regularly:
- The script is designed to update its calculations automatically whenever a new price bar appears on the chart. This ensures that the support and resistance zones are kept current with the latest price action.
-
Deleting and Redrawing:
- The support and resistance objects are deleted from the chart when the script is removed from the chart. This ensures there are no leftover objects.
In Simple Terms:
Imagine the script as a tool that automatically draws lines on your chart to highlight potential "bouncing" or "stopping" points for the price. It uses a special price pattern called a "fractal" to identify these key areas of support (where the price might bounce up) and resistance (where the price might stop rising). The number of support and resistance areas to be drawn can be configured by the user. The script then automatically updates these lines as new price data becomes available.
//+------------------------------------------------------------------+
//|                                                       SupDem.mq4 |
//|                      Copyright © 2008, MetaQuotes Software Corp. |
//|                                        http://www.metaquotes.net |
//+------------------------------------------------------------------+
#property copyright "Copyright © 2008, MetaQuotes Software Corp."
#property link      "http://www.metaquotes.net"

#property indicator_chart_window
extern int NumberOfSupDem=2;
extern color TopColor=Maroon;
extern color BotColor=DarkBlue;


//+------------------------------------------------------------------+
//| Custom indicator initialization function                         |
//+------------------------------------------------------------------+
int init()
  {
//---- indicators
//----
   return(0);
  }
//+------------------------------------------------------------------+
//| Custom indicator deinitialization function                       |
//+------------------------------------------------------------------+
int deinit()
  {
//----
 int total=NumberOfSupDem;
 for(int i=1;i<=total;i++)
 {
 ObjectDelete("SupDemUP"+i);
 ObjectDelete("SupDemDN"+i);
 }
//----
   return(0);
  }
//+------------------------------------------------------------------+
//| Custom indicator iteration function                              |
//+------------------------------------------------------------------+
int start()
  {
   int    counted_bars=IndicatorCounted();

//----
if(NewBar()==true)
{
for(int i=1;i<=NumberOfSupDem;i++)
{
PlaceSupDemUP(i);
PlaceSupDemDN(i);
}
}
//----
   return(0);
  }
//+------------------------------------------------------------------+
//                                                    |
//| Îïèñàíèå : Ïîèñê áëèæàéøåãî ôðàêòàëà.                                      |
//+----------------------------------------------------------------------------+
//| Ïàðàìåòðû:                                                                 |
//|   sy - íàèìåíîâàíèå èíñòðóìåíòà     (NULL - òåêóùèé ñèìâîë)                |
//|   tf - òàéìôðåéì                    (  0  - òåêóùèé ÒÔ)                    |
//|   mode - òèï ôðàêòàëà               (MODE_LOWER|MODE_UPPER)
//      count - ïîðÿäêîâûé íîìåð ôðàêòàëà         |
//+----------------------------------------------------------------------------+
double FindNearFractal(string sy="0", int tf=0, int mode=MODE_LOWER, int count=1) {
  if (sy=="" || sy=="0") sy=Symbol();
  double f=0;
  int d=MarketInfo(sy, MODE_DIGITS), s;
  if (d==0) if (StringFind(sy, "JPY")<0) d=4; else d=2;
 int c=0;
  for (s=2; s<100; s++) {
    f=iFractals(sy, tf, mode, s);
    if (f!=0)
    {
    c++;
    if(c==count) return(NormalizeDouble(s, d));
    }
  }
  Print("FindNearFractal(): Ôðàêòàë íå íàéäåí");
  return(0);
}

int PlaceSupDemUP(int count=1)
{
int per;
if (Period()>PERIOD_H1) per=Period(); else per=PERIOD_D1;

int barshift=FindNearFractal("0", per,MODE_UPPER,count);
if(ObjectFind("SupDemUP"+count)==-1) ObjectCreate("SupDemUP"+count,OBJ_RECTANGLE,0,iTime(NULL,per,barshift),iHigh(NULL,per,barshift),Time[0],MathMax(iClose(NULL,per,barshift),iOpen(NULL,per,barshift)));
ObjectSet("SupDemUP"+count,OBJPROP_TIME1,iTime(NULL,per,barshift));
ObjectSet("SupDemUP"+count,OBJPROP_PRICE1,iHigh(NULL,per,barshift));
ObjectSet("SupDemUP"+count,OBJPROP_TIME2,Time[0]);
ObjectSet("SupDemUP"+count,OBJPROP_PRICE2,MathMax(iClose(NULL,per,barshift),iOpen(NULL,per,barshift)));
ObjectSet("SupDemUP"+count,OBJPROP_COLOR,TopColor);
return(0);
}

int PlaceSupDemDN(int count=1)
{
int per;
if (Period()>PERIOD_H1) per=Period(); else per=PERIOD_D1;

int barshift=FindNearFractal("0", per,MODE_LOWER,count);
if(ObjectFind("SupDemDN"+count)==-1) ObjectCreate("SupDemDN"+count,OBJ_RECTANGLE,0,iTime(NULL,per,barshift),MathMin(iClose(NULL,per,barshift),iOpen(NULL,per,barshift)),Time[0],iLow(NULL,per,barshift));
ObjectSet("SupDemDN"+count,OBJPROP_TIME1,iTime(NULL,per,barshift));
ObjectSet("SupDemDN"+count,OBJPROP_PRICE1,MathMin(iClose(NULL,per,barshift),iOpen(NULL,per,barshift)));
ObjectSet("SupDemDN"+count,OBJPROP_TIME2,Time[0]);
ObjectSet("SupDemDN"+count,OBJPROP_PRICE2,iLow(NULL,per,barshift));
ObjectSet("SupDemDN"+count,OBJPROP_COLOR,BotColor);
return(0);
}

bool NewBar() {

	static datetime LastTime = 0;

	if (Time[0] != LastTime) {
		LastTime = Time[0];
		return (true);
	} else
		return (false);
}
Comments