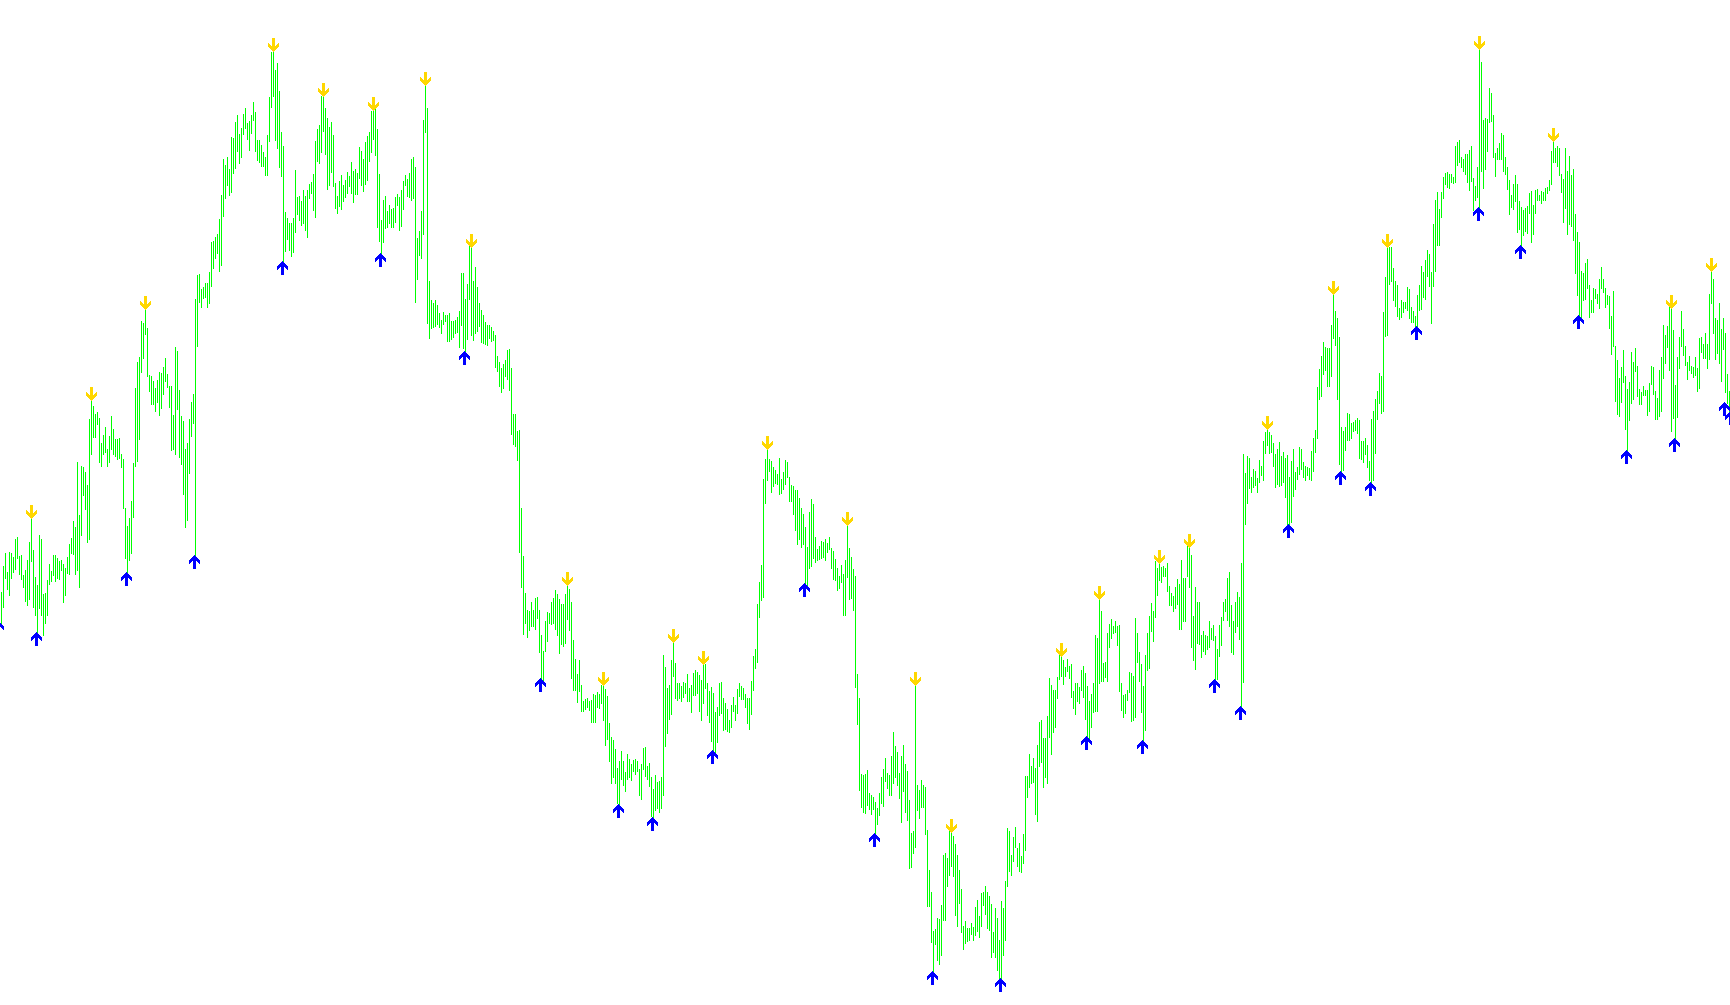
This technical indicator is designed to identify and visualize key structural pivot points on a trading chart by scanning for local highs and lows within a specific price window. By highlighting these "turning points," the tool helps traders visually recognize areas where the market may be experiencing significant shifts in momentum or price action.
Core Logic and Functionality
The script operates by constantly scanning the historical price data to find extreme values—specifically the highest peaks and the lowest troughs—over a defined period of time (represented by the dist variable). Rather than looking at the entire chart at once, it focuses on a moving window of candles to determine where the current price stands relative to its immediate neighbors.
How the identification works:
- Scanning for Peaks: The logic looks backward through a set number of candles to find the highest price reached during that interval. When the script identifies that the current candle is that highest point, it marks it as a significant "high."
- Scanning for Troughs: Simultaneously, the logic identifies the lowest price reached within that same interval. When the current candle is identified as that lowest point, it marks it as a significant "low."
- Visual Signaling: Once these points are identified, the script places visual markers (arrows) directly on the chart.
- Red Arrows are placed slightly above the price peaks to highlight upper resistance or structural highs.
- Lime Arrows are placed slightly below the price troughs to highlight lower support or structural lows.
Key Parameters
The behavior of the indicator is influenced by a specific "Signal Gap." This setting ensures that the visual arrows do not sit directly on top of the price candles, providing a small amount of breathing room so the user can clearly see the price action while still identifying the exact point where the peak or trough occurred.
Summary for the Trader
Essentially, this tool acts as an automated "swing point" finder. It filters out minor market noise to highlight only the most prominent local highs and lows. By providing these visual cues, it allows you to see the underlying structure of the market more clearly, making it easier to identify potential support and resistance zones at a glance.
#property indicator_chart_window
#property indicator_buffers 2
#property indicator_color1 Red
#property indicator_width1 2
#property indicator_color2 Lime
#property indicator_width2 2

extern int SignalGap = 4;

int dist=24;
double b1[];
double b2[];

int init() {
SetIndexStyle( 0,DRAW_ARROW, STYLE_SOLID, 1);
SetIndexStyle( 1,DRAW_ARROW, STYLE_SOLID, 1);
SetIndexArrow( 1,233);
SetIndexArrow( 0,234);
SetIndexBuffer( 0,b1);
SetIndexBuffer( 1,b2);
return(0);
}
int start() {
int counted_bars= IndicatorCounted ();
int k,i,j,limit, hhb,llb;

if (counted_bars< 0) return(-1);
if (counted_bars> 0) counted_bars--;
limit=Bars-1;
if(counted_bars>=1) limit=Bars-counted_bars-1;
if (limit<0) limit=0;

for (i=limit;i>= 0;i--) {
hhb = Highest(NULL, 0,MODE_HIGH, dist,i-dist/ 2);
llb = Lowest(NULL, 0,MODE_LOW, dist,i-dist/ 2);

if (i==hhb)
b1[i]=High[hhb] +SignalGap* Point;
if (i==llb)
b2[i]=Low[llb] -SignalGap* Point;
}
return(0);
}
Comments