super-signals_v1
Download script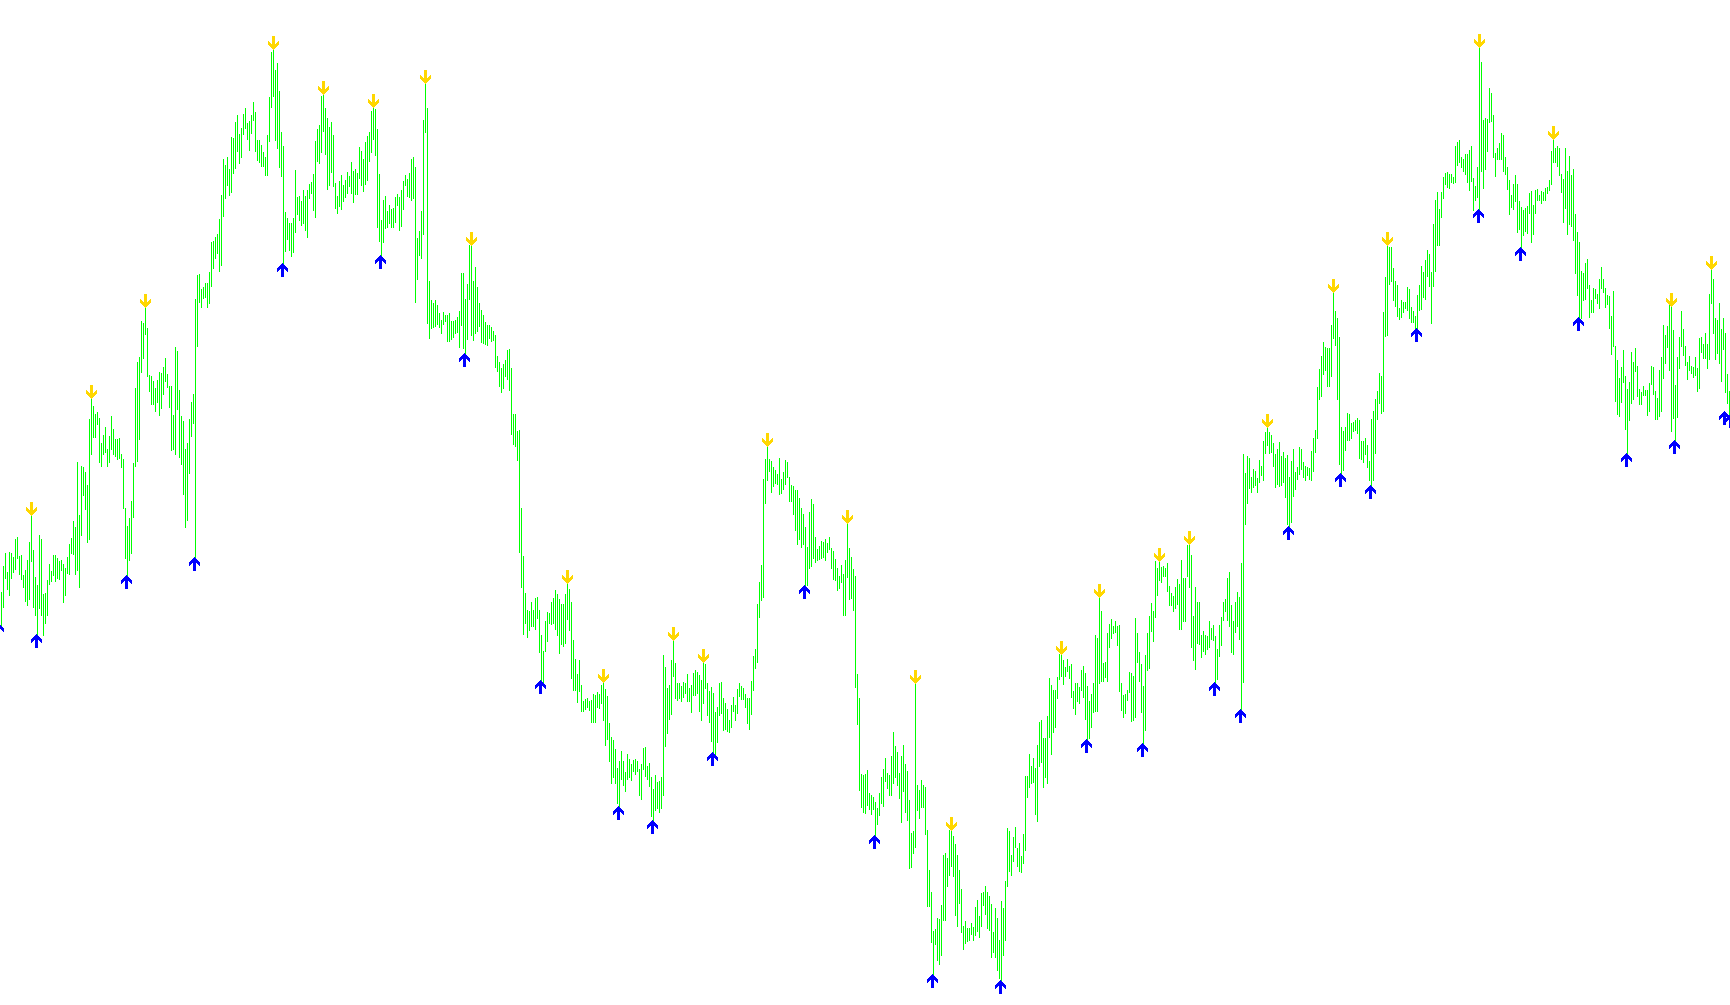
This tool is designed to simplify the process of identifying key structural points on a price chart by automatically highlighting significant peaks and valleys. Instead of requiring you to manually scan every candle for trend reversals, the script systematically analyzes price action to pinpoint where the market reached its highest and lowest levels over a specific period.
How the Logic Works
The script operates by constantly scanning the historical price data of your current chart. Here is the step-by-step breakdown of its logic:
- Scanning Windows: The indicator looks at a set "window" of price bars (defined by a fixed distance). By looking at these clusters of candles rather than just one at a time, it helps filter out minor market noise and focuses on more substantial price movements.
- Identifying Extremes: Within each of these windows, the logic performs two simultaneous checks:
- It identifies the Highest High: The specific candle where the price reached its peak within that timeframe.
- It identifies the Lowest Low: The specific candle where the price dropped to its deepest point within that same timeframe.
- Visual Signaling: Once these high and low points are confirmed, the script places a visual marker on the chart:
- Peak Markers: An arrow is placed just above the highest price point found.
- Valley Markers: An arrow is placed just below the lowest price point found.
- Spacing and Clarity: To ensure that these signals do not overlap with the actual price candles (which could make the chart messy or difficult to read), the script includes a "Signal Gap." This creates a small, consistent buffer of empty space between the price action and the indicator's arrows.
Summary for Traders
In essence, this tool acts as an automated "high-low" tracker. It paints the scenery for you by marking out the major turning points in the market. By identifying these structural extremes, it allows you to quickly see where momentum may have shifted, helping you visualize support and resistance levels more clearly without having to manually plot them yourself.
/*-----------------------------+
|			       |
| Shared by www.Aptrafx.com    |
|			       |
+------------------------------*/

//+------------------------------------------------------------------+
//|                                                super-signals.mq4 |
//|                Copyright © 2006, Nick Bilak, beluck[AT]gmail.com |
//+------------------------------------------------------------------+
#property copyright "Copyright © 2006, Nick Bilak"
#property link      "http://www.forex-tsd.com/"

#property indicator_chart_window
#property indicator_buffers 2
#property indicator_color1 Yellow
#property indicator_color2 Aqua

extern int SignalGap = 10;

int dist=24;
double b1[];
double b2[];

int init()  {
   SetIndexStyle(0,DRAW_ARROW,STYLE_SOLID,1);
   SetIndexStyle(1,DRAW_ARROW,STYLE_SOLID,1);
   SetIndexArrow(1,233);
   SetIndexArrow(0,234);
   SetIndexBuffer(0,b1);
   SetIndexBuffer(1,b2);
   return(0);
}
int start() {
   int counted_bars=IndicatorCounted();
   int k,i,j,limit,hhb,llb;

   if (counted_bars<0) return(-1);
   if (counted_bars>0) counted_bars--;
   limit=Bars-1;
   if(counted_bars>=1) limit=Bars-counted_bars-1;
   if (limit<0) limit=0;

   for (i=limit;i>=0;i--)   {
      hhb = Highest(NULL,0,MODE_HIGH,dist,i-dist/2);
      llb = Lowest(NULL,0,MODE_LOW,dist,i-dist/2);

      if (i==hhb)
         b1[i]=High[hhb]+SignalGap*Point;
      if (i==llb)
         b2[i]=Low[llb]-SignalGap*Point;
   }
   return(0);
}
Comments