super-signals_v2b
Download script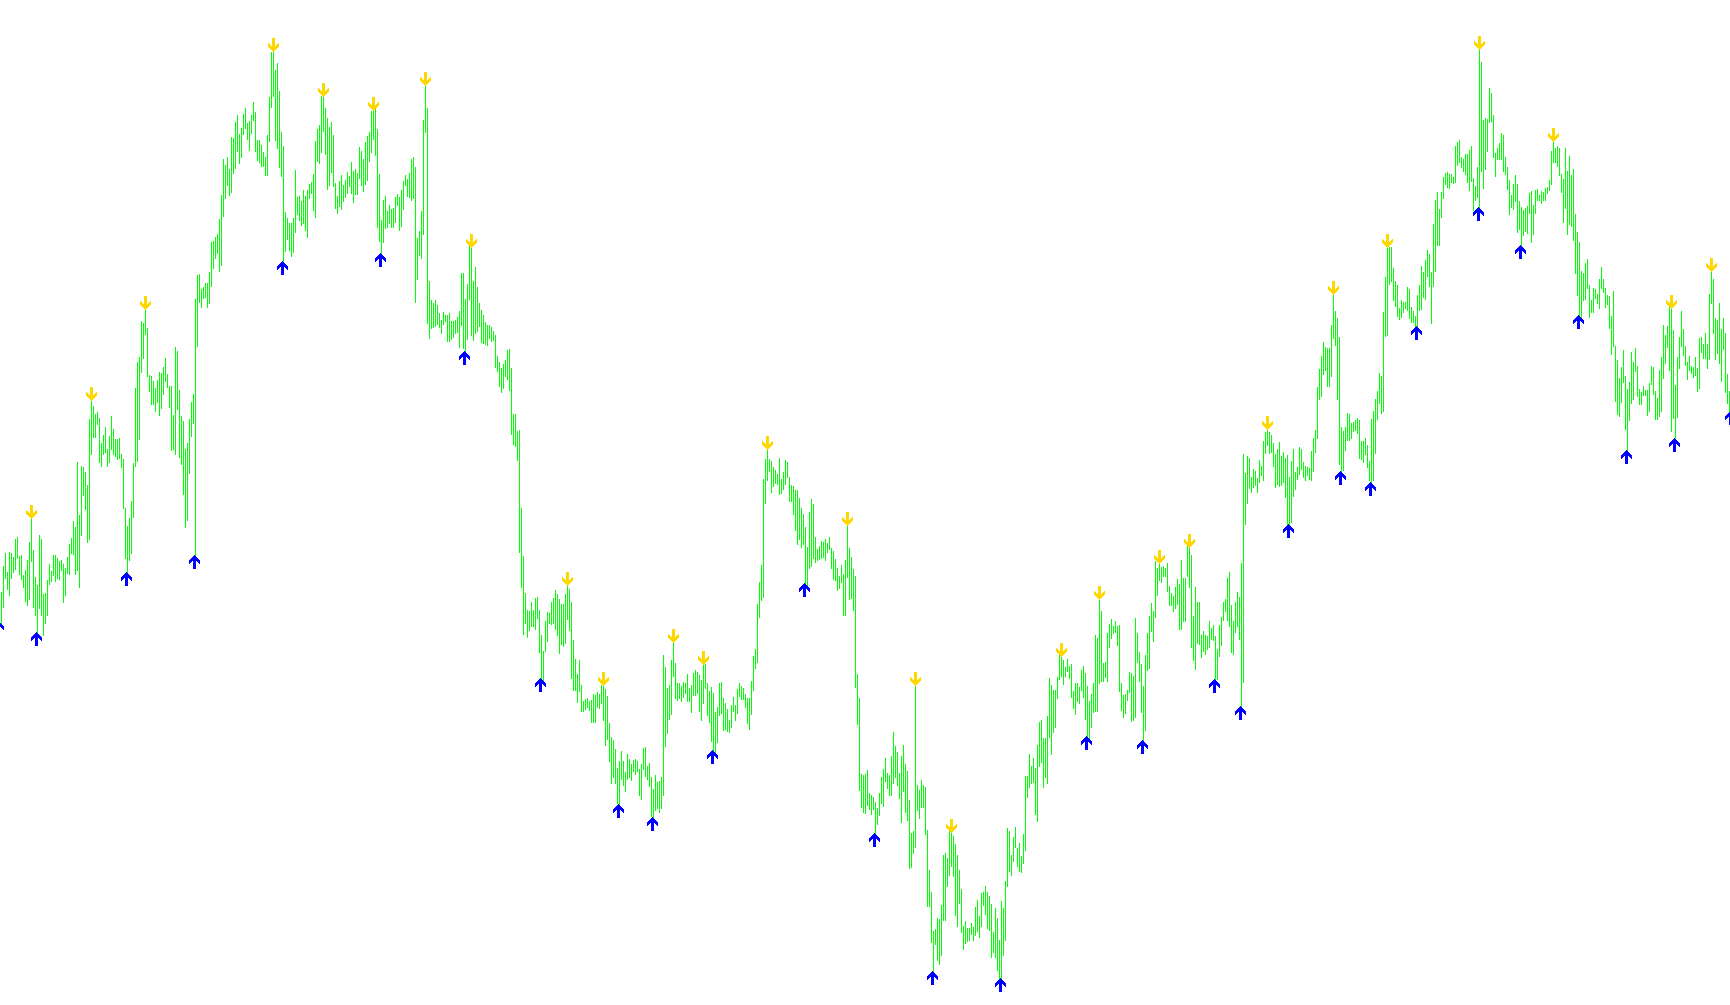
This tool is designed to identify significant price extremes on a trading chart by visually highlighting historical "peaks" and "valleys." Instead of relying on complex moving averages or momentum oscillators, the script focuses on the raw geometry of price action to pinpoint where the market has reached its highest and lowest points over a specific window of time.
How the Logic Works
1. Defining the Lookback Window The script operates by constantly scanning a fixed "neighborhood" of price data (defined by a distance of 24 bars). By looking at this specific range, the tool ensures that it is evaluating relatively recent price behavior rather than the entire history of the asset.
2. Peak and Valley Identification For every candle on your chart, the script performs two simultaneous checks:
- The High Point: It searches the defined neighborhood to find the single highest price point reached. If the current candle being analyzed is that specific high point, the script flags it.
- The Low Point: It simultaneously searches the same neighborhood for the single lowest price point. If the current candle is that specific low, it gets flagged as well.
3. Visual Signaling Once a peak or valley is identified, the script places a visual marker on the chart to make it immediately obvious to the trader:
- Red Signals: These appear above the high points of the peaks.
- Lime Signals: These appear below the low points of the valleys.
4. Precision Placement To ensure the markers do not overlap with the actual candles, the logic includes a small "gap" setting. This pushes the signals slightly away from the price action—placing the red signal just above the high and the lime signal just below the low—providing a clean, uncluttered view of the market's structure.
Summary for Traders
Essentially, this script acts as an automated "high-low" scanner. It removes the manual effort of hunting for swing points by scanning the market for you and marking the exact structural turning points where price reached its local maximum or minimum within a set timeframe.
//+------------------------------------------------------------------+
//|                                                super-signals.mq4 |
//|                Copyright © 2006, Nick Bilak, beluck[AT]gmail.com |
//+------------------------------------------------------------------+
#property copyright "Copyright © 2006, Nick Bilak"
#property link      "http://www.forex-tsd.com/"

#property indicator_chart_window
#property indicator_buffers 2
#property indicator_color1 Red
#property indicator_width1 2
#property indicator_color2 Lime
#property indicator_width2 2

extern int SignalGap = 4;

int dist=24;
double b1[];
double b2[];

int init()  {
   SetIndexStyle(0,DRAW_ARROW,STYLE_SOLID,1);
   SetIndexStyle(1,DRAW_ARROW,STYLE_SOLID,1);
   SetIndexArrow(1,233);
   SetIndexArrow(0,234);
   SetIndexBuffer(0,b1);
   SetIndexBuffer(1,b2);
   return(0);
}
int start() {
   int counted_bars=IndicatorCounted();
   int k,i,j,limit,hhb,llb;

   if (counted_bars<0) return(-1);
   if (counted_bars>0) counted_bars--;
   limit=Bars-1;
   if(counted_bars>=1) limit=Bars-counted_bars-1;
   if (limit<0) limit=0;

   for (i=limit;i>=0;i--)   {
//      b1[i]=EMPTY_VALUE;
//      b2[i]=EMPTY_VALUE;
      b1[i]=0;
      b2[i]=0;
      hhb = iHighest(NULL,0,MODE_HIGH,dist,i-dist/2);
      llb = iLowest(NULL,0,MODE_LOW,dist,i-dist/2);

      if (i==hhb)
         b1[i]=High[hhb]+SignalGap*Point;
      if (i==llb)
         b2[i]=Low[llb]-SignalGap*Point;
   }
   return(0);
}
Comments