St_LRegr
Download script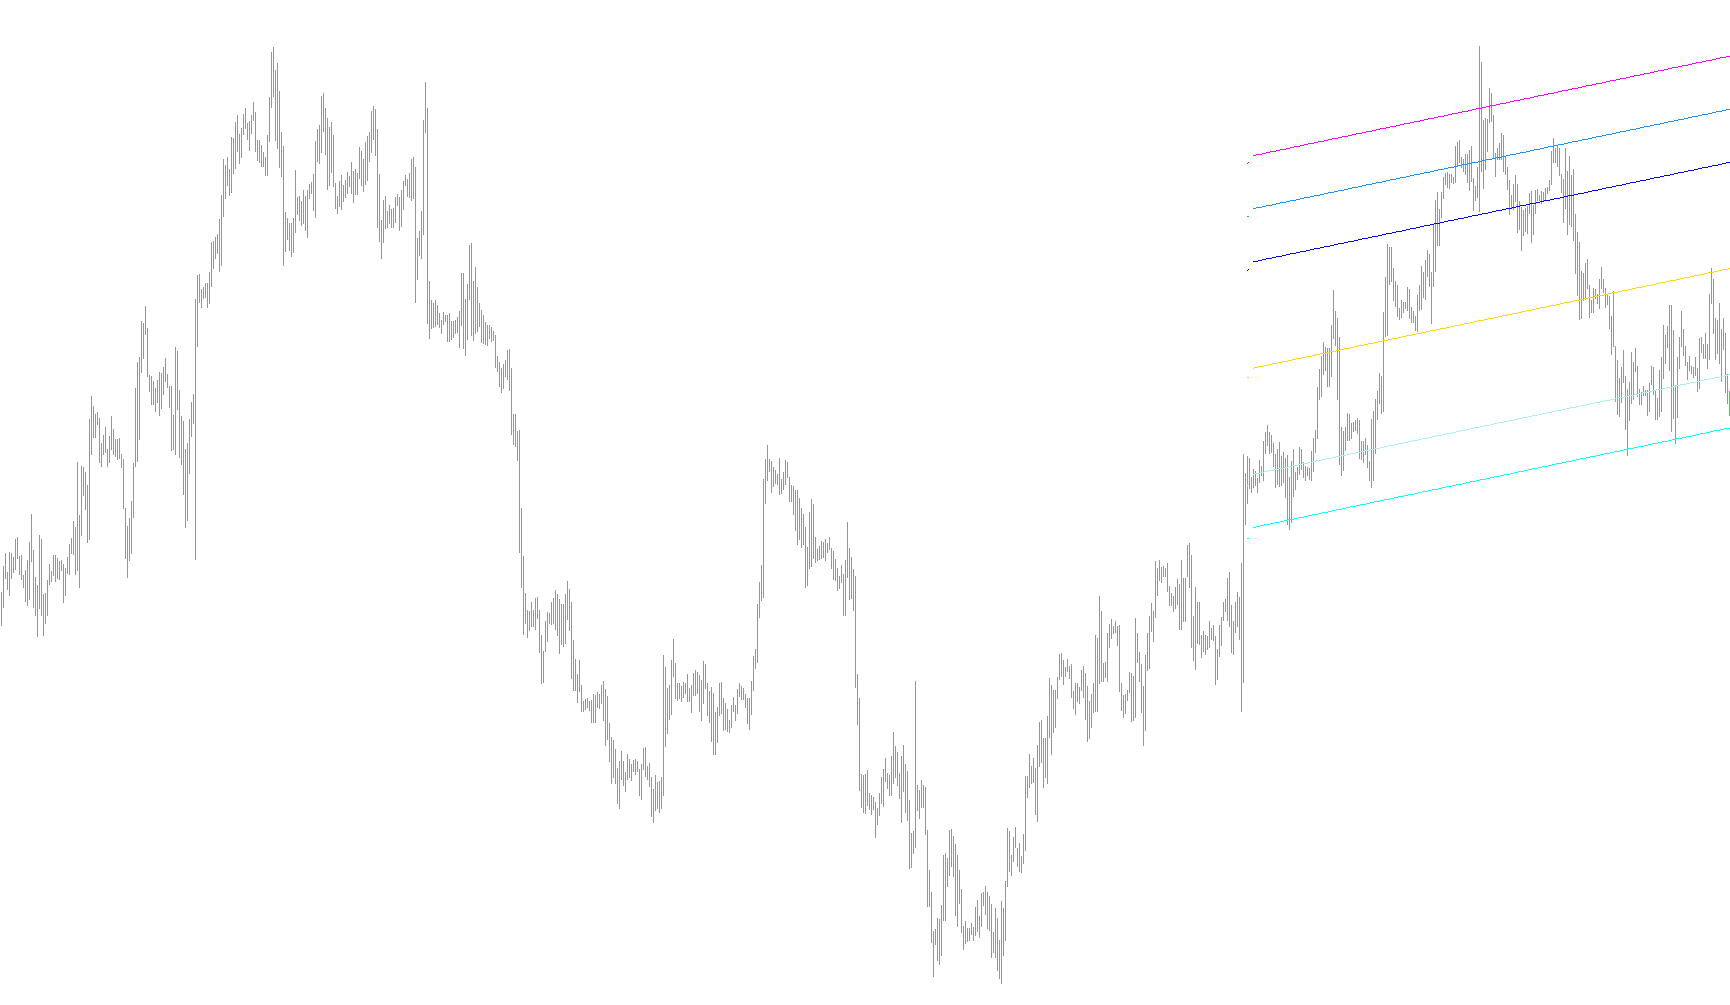
This tool is designed to provide a clear visual representation of price trends by using a mathematical technique known as Linear Regression. Essentially, it takes the recent history of market prices and calculates a "line of best fit"—a straight path that most accurately follows the direction in which the market has been moving over a specific period.
Core Functionality
The script analyzes a set number of previous price points (determined by the user) to identify the overall trajectory of the market. Instead of just showing you where the price was, it calculates where the price "should" be based on its recent momentum. This allows traders to see the underlying trend more clearly by filtering out minor, short-term fluctuations or "noise."
Key Components of the Logic
- Trend Line Calculation: The tool identifies a central path (the regression line). This represents the average direction of the market. If the price is above this line, it suggests a bullish lean; if below, a bearish lean.
- Volatility Measurement: Beyond just finding the trend, the script calculates the "Standard Deviation." In simple terms, this measures how much the price typically swings away from the central trend line. This helps determine whether the market is behaving calmly or experiencing high-intensity volatility.
- Dynamic Channels: Using both the trend and the volatility data, the tool generates a series of parallel lines surrounding the main trend. These act as boundaries:
- Inner Boundaries: These represent the "normal" range of price movement based on current volatility.
- Outer Boundaries: These extend further out to highlight extreme movements. When the price pushes toward or beyond these outer limits, it signals that the market is reaching an overextended state.
Visual Summary
When applied to a chart, this logic creates a multi-layered corridor. It provides you with a visual "lane" for the price to travel in. By observing how the price interacts with these various levels—moving toward the edges or bouncing back toward the center—you can better visualize the balance between the current trend and the market's natural fluctuations.
//+------------------------------------------------------------------+
//|                                                     St_LRegr.mq4 |
//|                                                         Stajer59 |
//|                                      http://www.stajer59.ucoz.ru |
//+------------------------------------------------------------------+
#property copyright "Stajer59"
#property link      "http://www.stajer59.ucoz.ru"

#property indicator_chart_window
#property indicator_buffers 7
#property indicator_color1 Red
#property indicator_color2 Green
#property indicator_color3 Green
#property indicator_color4 PaleTurquoise
#property indicator_color5 PaleTurquoise
#property indicator_color6 Silver
#property indicator_color7 Silver

//---- input parameters
extern int       N=240;
extern double    StdDev=1.0;
//---- buffers
double ExtMapBuffer1[];
double ExtMapBuffer2[];
double ExtMapBuffer3[];
double ExtMapBuffer4[];
double ExtMapBuffer5[];
double ExtMapBuffer6[];
double ExtMapBuffer7[];
//+------------------------------------------------------------------+
int init()
  {
   SetIndexStyle(0,DRAW_LINE);
   SetIndexBuffer(0,ExtMapBuffer1);
   SetIndexStyle(1,DRAW_LINE);
   SetIndexBuffer(1,ExtMapBuffer2);
   SetIndexStyle(2,DRAW_LINE);
   SetIndexBuffer(2,ExtMapBuffer3);
   SetIndexStyle(3,DRAW_LINE);
   SetIndexBuffer(3,ExtMapBuffer4);
   SetIndexStyle(4,DRAW_LINE);
   SetIndexBuffer(4,ExtMapBuffer5);
   SetIndexStyle(5,DRAW_LINE);
   SetIndexBuffer(5,ExtMapBuffer6);
   SetIndexStyle(6,DRAW_LINE);
   SetIndexBuffer(6,ExtMapBuffer7);

   return(0);
  }
//+------------------------------------------------------------------+
int deinit()
  {
   return(0);
  }
//+------------------------------------------------------------------+
int start()
  {
   int    j;
   double   a,b,Summ_x,Summ_y,Summ_x_2,Summ_xy,Deviation,StdDeviation,Sredn_y;
   if (Bars < N+1) return(0);
   for (int x=1;x<=N;x++)
   {  j=N-x;
      Summ_x=Summ_x+x;
      Summ_y=Summ_y+Close[j];
      Summ_xy=Summ_xy+x*Close[j];
      Summ_x_2=Summ_x_2+MathPow(x,2);
   }
      b=(N*Summ_xy-Summ_x*Summ_y)/(N*Summ_x_2-MathPow(Summ_x,2));
      a=(Summ_y-b*Summ_x)/N;
      Sredn_y=Summ_y/N;
   for (x=1;x<=N;x++)
      {
         j=N-x;
         Deviation=Deviation+MathPow((Close[j]-Sredn_y),2);
      }
      StdDeviation=MathSqrt(Deviation/N);
      ExtMapBuffer1[N]=EMPTY_VALUE;
      ExtMapBuffer2[N]=EMPTY_VALUE;
      ExtMapBuffer3[N]=EMPTY_VALUE;
      ExtMapBuffer4[N]=EMPTY_VALUE;
      ExtMapBuffer5[N]=EMPTY_VALUE;
      ExtMapBuffer6[N]=EMPTY_VALUE;
      ExtMapBuffer7[N]=EMPTY_VALUE;

    for (x=1;x<=N;x++)
      {  j=N-x;
         ExtMapBuffer1[j]=b*x+a;
         ExtMapBuffer2[j]=b*x+a+StdDev*StdDeviation;
         ExtMapBuffer3[j]=b*x+a-StdDev*StdDeviation;
         ExtMapBuffer4[j]=b*x+a+1.5*StdDev*StdDeviation;
         ExtMapBuffer5[j]=b*x+a-1.5*StdDev*StdDeviation;
         ExtMapBuffer6[j]=b*x+a+2.0*StdDev*StdDeviation;
         ExtMapBuffer7[j]=b*x+a-2.0*StdDev*StdDeviation;
      }

   return(0);
  }
//+------------------------------------------------------------------+
Comments