SuperSR 6
Download script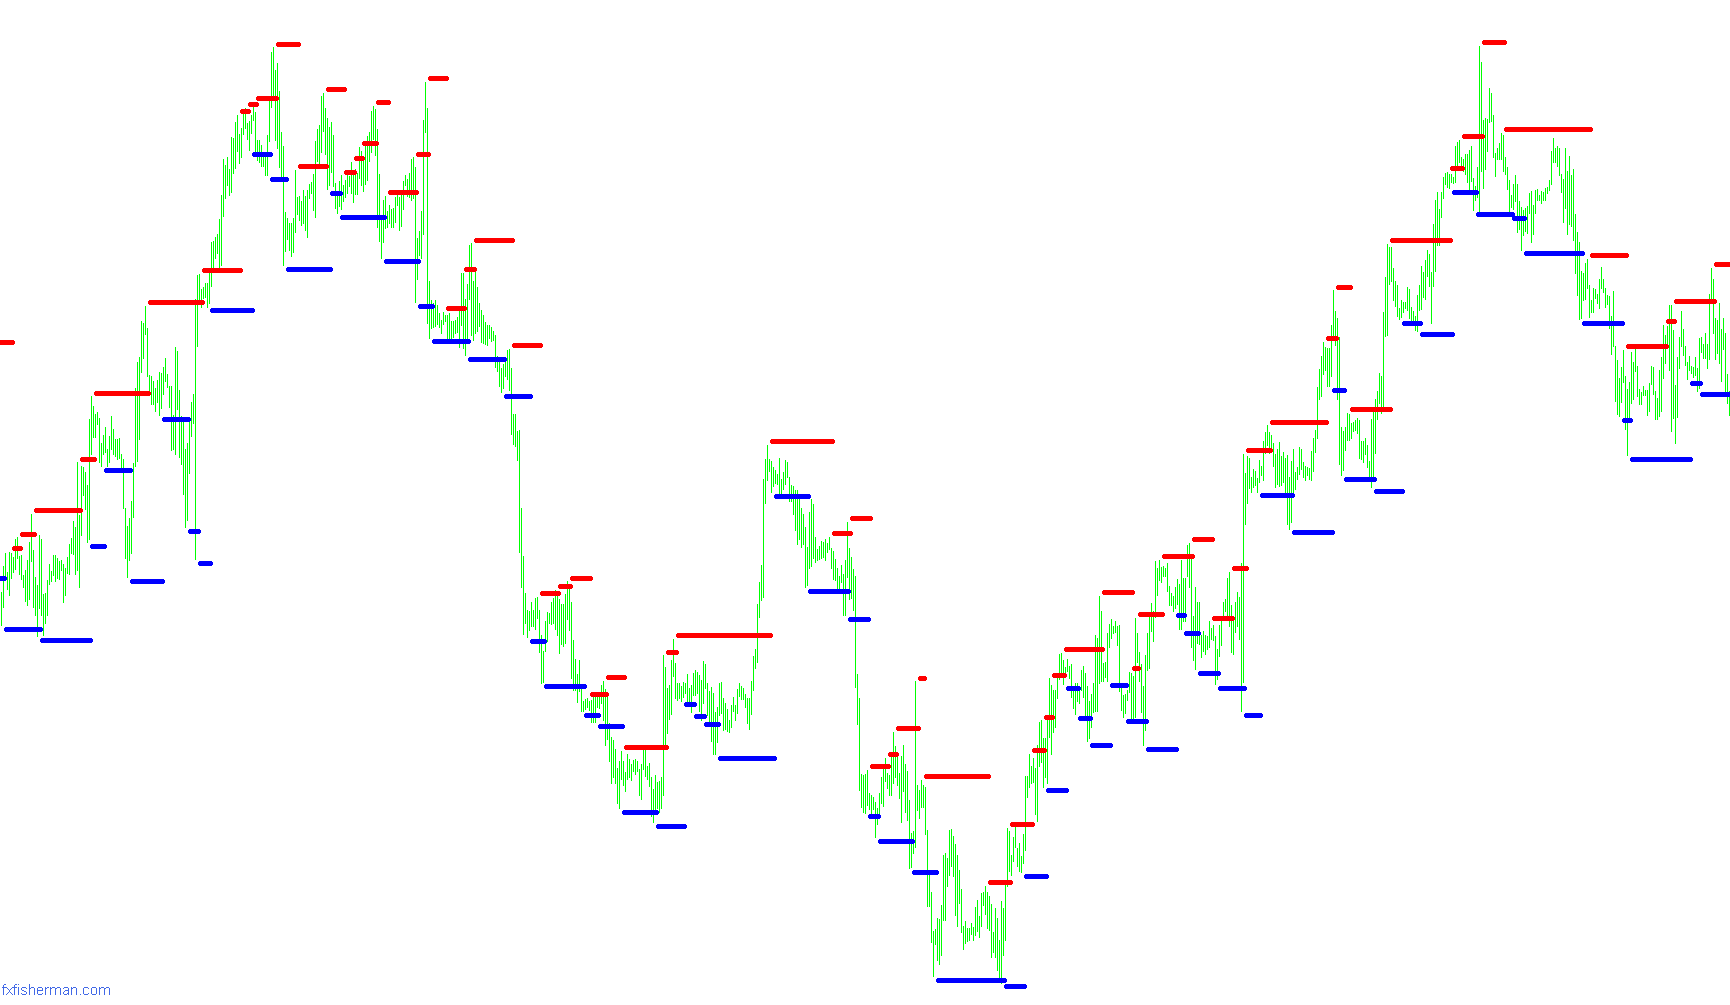
This tool is designed to automatically identify and plot key price levels on your trading chart—specifically areas of Resistance (where prices struggle to rise further) and Support (where prices struggle to fall further). By visualizing these zones, the indicator helps traders understand where historical price action has stalled.
How the Logic Works
The script operates by scanning historical price data to find specific "Fractal" points. A fractal is essentially a peak or a valley:
- Resistance Points: The logic looks for a high point that is higher than the candles immediately surrounding it.
- Support Points: The logic looks for a low point that is lower than the candles immediately surrounding it.
Smart Level Detection
Rather than marking every single small fluctuation as a significant level, the script uses a "Gap" logic to filter out market noise. It evaluates whether a newly discovered fractal point is far enough away from the previous identified level.
- The Distance Rule: The tool checks if the distance between the new price peak/valley and the last recorded level meets a specific minimum threshold (the "Contract Step").
- Updating Levels: If the distance is significant enough, the script "locks in" this new price as the current Resistance or Support level. If the price movement is too small or happens too close to the existing level, the script ignores it and maintains the previous boundary.
Visual Output on Your Chart
Once these levels are calculated, the tool provides clear visual cues:
- Red Arrows: These mark the identified Resistance levels.
- Blue Arrows: These mark the identified Support levels.
By automating this process, the script ensures that you are viewing significant structural boundaries based on historical price behavior, allowing for a cleaner analysis of where the market might react in the future.
//+------------------------------------------------------------------+
//|                SuperSR 6.mq4                                     |
//|                Copyright © 2006  Scorpion@fxfisherman.com        |
//+------------------------------------------------------------------+
#property copyright "FxFisherman.com"
#property link      "http://www.fxfisherman.com"

#property indicator_chart_window
#property indicator_buffers 2
#property indicator_color1 Red
#property indicator_color2 Blue

extern int Contract_Step=150;
extern int Precision=10;
extern int Shift_Bars=1;

//---- buffers
double v1[];
double v2[];
double val1;
double val2;

int init()
  {

   IndicatorBuffers(2);

   SetIndexArrow(0, 159);
   SetIndexStyle(0,DRAW_ARROW,STYLE_SOLID,1,Red);
   SetIndexDrawBegin(0,-1);
   SetIndexBuffer(0, v1);
   SetIndexLabel(0,"Resistance");

   SetIndexArrow(1, 159);
   SetIndexStyle(1,DRAW_ARROW,STYLE_SOLID,1,Blue);
   SetIndexDrawBegin(1,-1);
   SetIndexBuffer(1, v2);
   SetIndexLabel(1,"Support");

   watermark();

   return(0);
  }

int start()
 {
  double gap;
  double contract = (Contract_Step + Precision) * Point;
  int i = Bars;
  int shift;
  bool fractal;
  double price;

  while(i>=0)
   {
    shift = i + Shift_Bars;

    // Resistance
    price = High[shift+2];
    fractal = price >= High[shift+4] &&
              price >= High[shift+3] &&
              price > High[shift+1] &&
              price > High[shift];

    gap = v1[i+1] - price;
    if (fractal && (gap >= contract || gap < 0))
    {
      v1[i] = price + (Precision * Point);
    }else{
      v1[i] = v1[i+1];
    }

    // Support
    price = Low[shift+2];
    fractal = price <= Low[shift+4] &&
              price <= Low[shift+3] &&
              price < Low[shift+1] &&
              price < Low[shift];

    gap = price - v2[i+1];
    if (fractal && (gap >= contract || gap < 0))
    {
      v2[i] = price - (Precision * Point);
    }else{
      v2[i] = v2[i+1];
    }

    i--;
   }
  return(0);
 }

//+------------------------------------------------------------------+

void watermark()
  {
   ObjectCreate("fxfisherman", OBJ_LABEL, 0, 0, 0);
   ObjectSetText("fxfisherman", "fxfisherman.com", 11, "Lucida Handwriting", RoyalBlue);
   ObjectSet("fxfisherman", OBJPROP_CORNER, 2);
   ObjectSet("fxfisherman", OBJPROP_XDISTANCE, 5);
   ObjectSet("fxfisherman", OBJPROP_YDISTANCE, 10);
   return(0);
  }
Comments