super-signals-channel1
Download script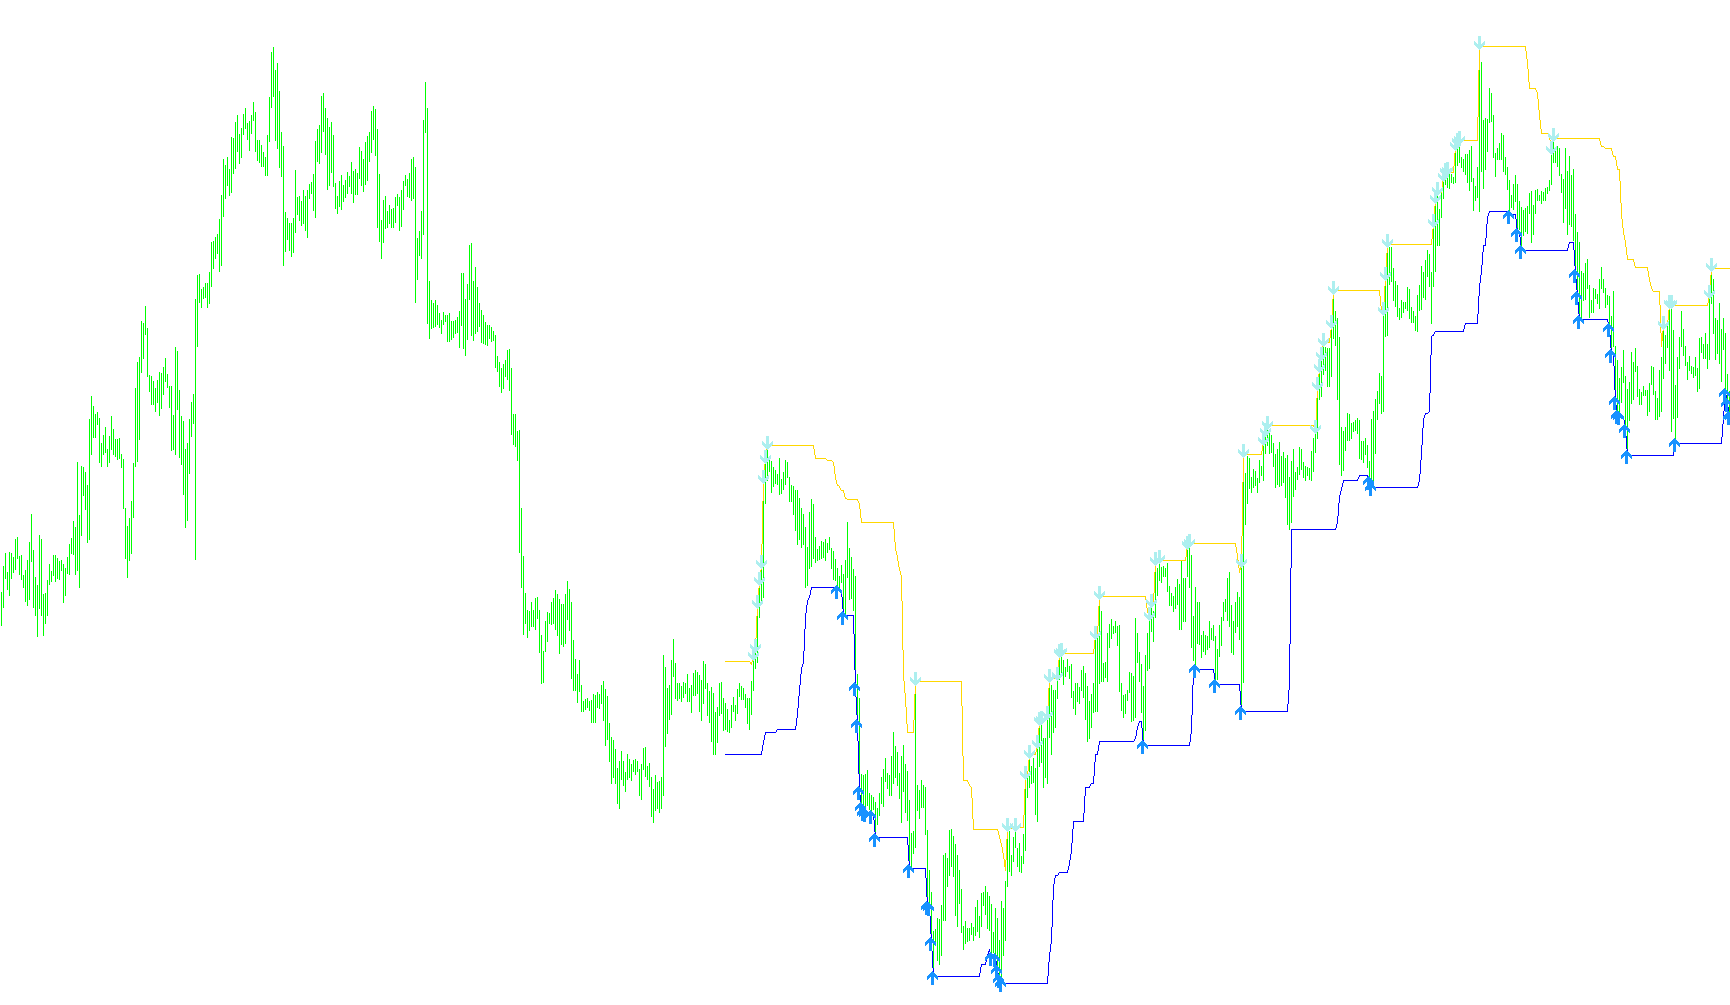
This tool is designed to provide visual clarity on a trading chart by identifying and highlighting specific price extremes within a defined rolling window. Instead of cluttering the screen with every minor fluctuation, it focuses on pinpointing the "peaks" and "valleys" of market activity to help traders visualize price channels more effectively.
How the Logic Works
1. Dynamic Range Scanning The script looks at a specific number of previous candles (the "distance") to determine the local high and low points. By analyzing this set of data, it identifies the highest price reached and the lowest price dropped within that timeframe. This allows the tool to ignore minor noise and focus on significant structural movements.
2. Peak and Valley Identification Once the highest and lowest points are identified within the designated range, the script marks these specific locations:
- High Points: It identifies the exact candle where the price reached its zenith.
- Low Points: It identifies the exact candle where the price hit its floor.
3. Visual Signaling To make these points easily visible to the user, the tool places distinct visual markers on the chart:
- Upper Signals: It places a marker slightly above the identified peak.
- Lower Signals: It places a marker slightly below the identified valley.
- Channel Lines: It draws lines connecting these high and low points, creating a visual "channel" that illustrates the boundaries of recent price action.
4. Real-Time vs. Historical Accuracy The logic includes a specific toggle for how the data is processed:
- Standard Mode: The tool identifies highs and lows based on completed movements, ensuring that once a signal appears, it remains fixed.
- Repaint Mode: If enabled, the tool dynamically recalculates the highest and lowest points as new price data comes in, allowing the signals to shift in real-time to reflect the most current "extreme" point in the market.
Key Benefits for the User
By highlighting these extremes, the script helps traders quickly see where the market is currently pushing against resistance (the high markers) or finding support (the low markers). It simplifies the process of reading complex price movements by distilling them into a clear visual channel of significant highs and lows.
//+------------------------------------------------------------------+
//|                                        super-signals-channel.mq4 |
//|                Copyright © 2006, Nick Bilak, beluck[AT]gmail.com |
//+------------------------------------------------------------------+

#property copyright "Copyright © 2006, Nick Bilak"
#property link      "http://www.forex-tsd.com/"

// hacked into a channel ind. by t_david sometime in early 2007

#property indicator_chart_window
#property indicator_buffers 4
#property indicator_color1 Red
#property indicator_width1 1
#property indicator_color2 Lime
#property indicator_width2 1
#property indicator_color3 Red
#property indicator_width3 1
#property indicator_color4 Lime
#property indicator_width4 1

extern int SignalGap = 4;
extern int ShowBars = 500;
extern bool repaint = false;

int dist=24;

double b1[];
double b2[];
double b3[];
double b4[];

int init()  {

   SetIndexStyle(0,DRAW_LINE,STYLE_SOLID,1);
   SetIndexStyle(1,DRAW_LINE,STYLE_SOLID,1);
   SetIndexStyle(2,DRAW_ARROW,STYLE_SOLID,1);
   SetIndexStyle(3,DRAW_ARROW,STYLE_SOLID,1);

   SetIndexBuffer(0,b1);
   SetIndexBuffer(1,b2);
   SetIndexBuffer(2,b3);
   SetIndexBuffer(3,b4);

   SetIndexArrow(2,234);
   SetIndexArrow(3,233);

   return(0);
}

int start() {

   int k,i,j,limit,hhb,llb;

   if (ShowBars >= Bars) ShowBars = Bars;

   for (i=0;i<ShowBars;i++)   {

      b1[i]=0;
      b2[i]=0;
      b3[i]=0;
      b4[i]=0;

      if(repaint)
      {
        hhb = iHighest(Symbol(),0,MODE_HIGH,dist,i-dist/2);
        llb = iLowest(Symbol(),0,MODE_LOW,dist,i-dist/2);
      } else
      {
        hhb = iHighest(Symbol(),0,MODE_HIGH,dist,i);
        llb = iLowest(Symbol(),0,MODE_LOW,dist,i);
      }


      if (i==hhb)
         b3[i]=High[hhb]+SignalGap*Point;

      if (i==llb)
         b4[i]=Low[llb]-SignalGap*Point;

         b1[i]=High[hhb];//+SignalGap*Point;
         b2[i]=Low[llb];//-SignalGap*Point;

   }
   return(0);
}
Comments