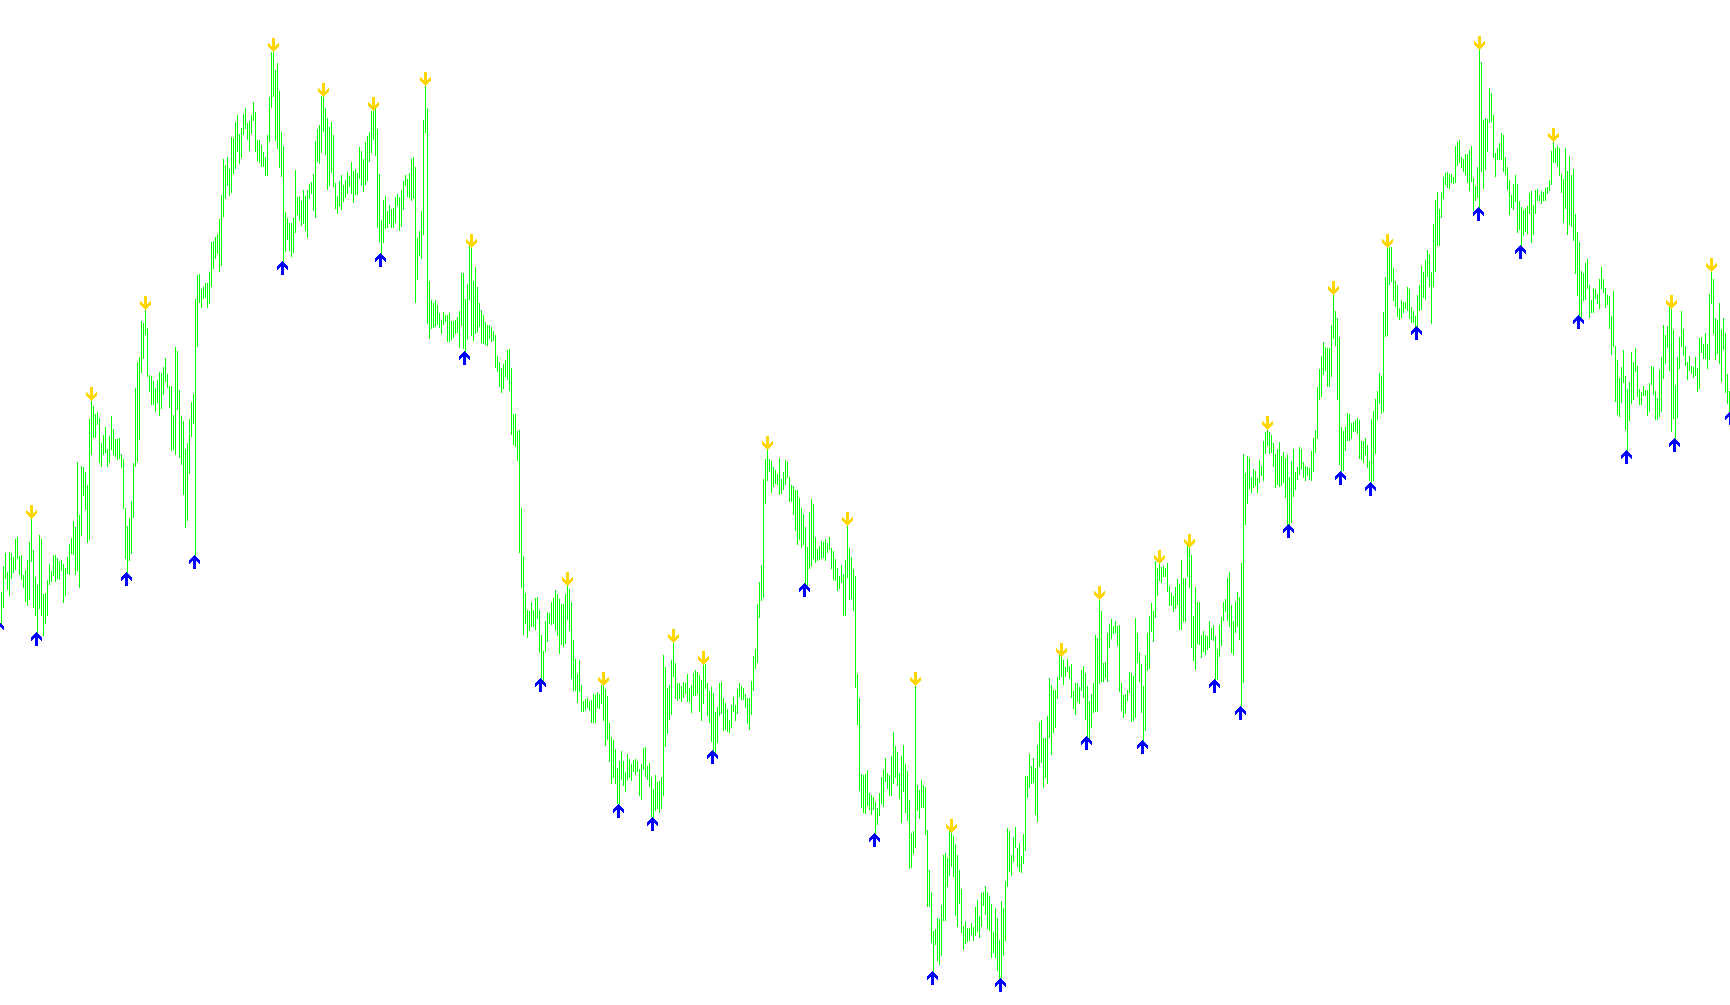
This tool is designed to provide visual cues on your trading charts by automatically identifying significant structural "turning points" in price action. Rather than relying on complex mathematical formulas or lagging averages, the logic focuses on local price extremes to highlight where the market reaches its highest and lowest points within a specific timeframe.
How it Works
The script scans the historical price data of your chart and looks at a fixed window of recent candles (defined by a set distance). For every point on the chart, it evaluates the surrounding area to see if the current candle represents the absolute peak (high) or the absolute valley (low) within that specific range.
Key Features
- Peak Detection: When the script identifies a candle as the highest point in its neighborhood, it places a red signal above that price point. This marks a potential area of resistance or a localized "ceiling."
- Valley Detection: Conversely, when it identifies a candle as the lowest point in its neighborhood, it places a lime-colored signal below that price point. This marks a potential area of support or a localized "floor."
- Visual Clarity: To ensure the signals do not overlap directly with the price candles, the script includes a customizable "gap." This ensures the markers sit clearly above or below the wicks, making them easy to see at a glance during live trading.
Trading Purpose
The primary goal of this logic is to filter out minor market noise and highlight major structural pivots. By identifying these local highs and lows, traders can better visualize the "skeleton" of the price movement, helping to identify areas where the trend might be exhausting or where price may encounter significant obstacles.
//+------------------------------------------------------------------+
//|                                                super-signals.mq4 |
//|                Copyright © 2006, Nick Bilak, beluck[AT]gmail.com |
//+------------------------------------------------------------------+
#property copyright "Copyright © 2006, Nick Bilak"
#property link      "http://www.forex-tsd.com/"

#property indicator_chart_window
#property indicator_buffers 2
#property indicator_color1 Red
#property indicator_width1 2
#property indicator_color2 Lime
#property indicator_width2 2

extern int SignalGap = 4;

int dist=24;
double b1[];
double b2[];

int init()  {
   SetIndexStyle(0,DRAW_ARROW,STYLE_SOLID,1);
   SetIndexStyle(1,DRAW_ARROW,STYLE_SOLID,1);
   SetIndexArrow(1,233);
   SetIndexArrow(0,234);
   SetIndexBuffer(0,b1);
   SetIndexBuffer(1,b2);
   return(0);
}
int start() {
   int counted_bars=IndicatorCounted();
   int k,i,j,limit,hhb,llb;

   if (counted_bars<0) return(-1);
   if (counted_bars>0) counted_bars--;
   limit=Bars-1;
   if(counted_bars>=1) limit=Bars-counted_bars-1;
   if (limit<0) limit=0;

   for (i=limit;i>=0;i--)   {
      b1[i]=EMPTY_VALUE;
      b2[i]=EMPTY_VALUE;
      hhb = iHighest(NULL,0,MODE_HIGH,dist,i-dist/2);
      llb = iLowest(NULL,0,MODE_LOW,dist,i-dist/2);

      if (i==hhb)
         b1[i]=High[hhb]+SignalGap*Point;
      if (i==llb)
         b2[i]=Low[llb]-SignalGap*Point;
   }
   return(0);
}
Comments