st_ind_2
Download script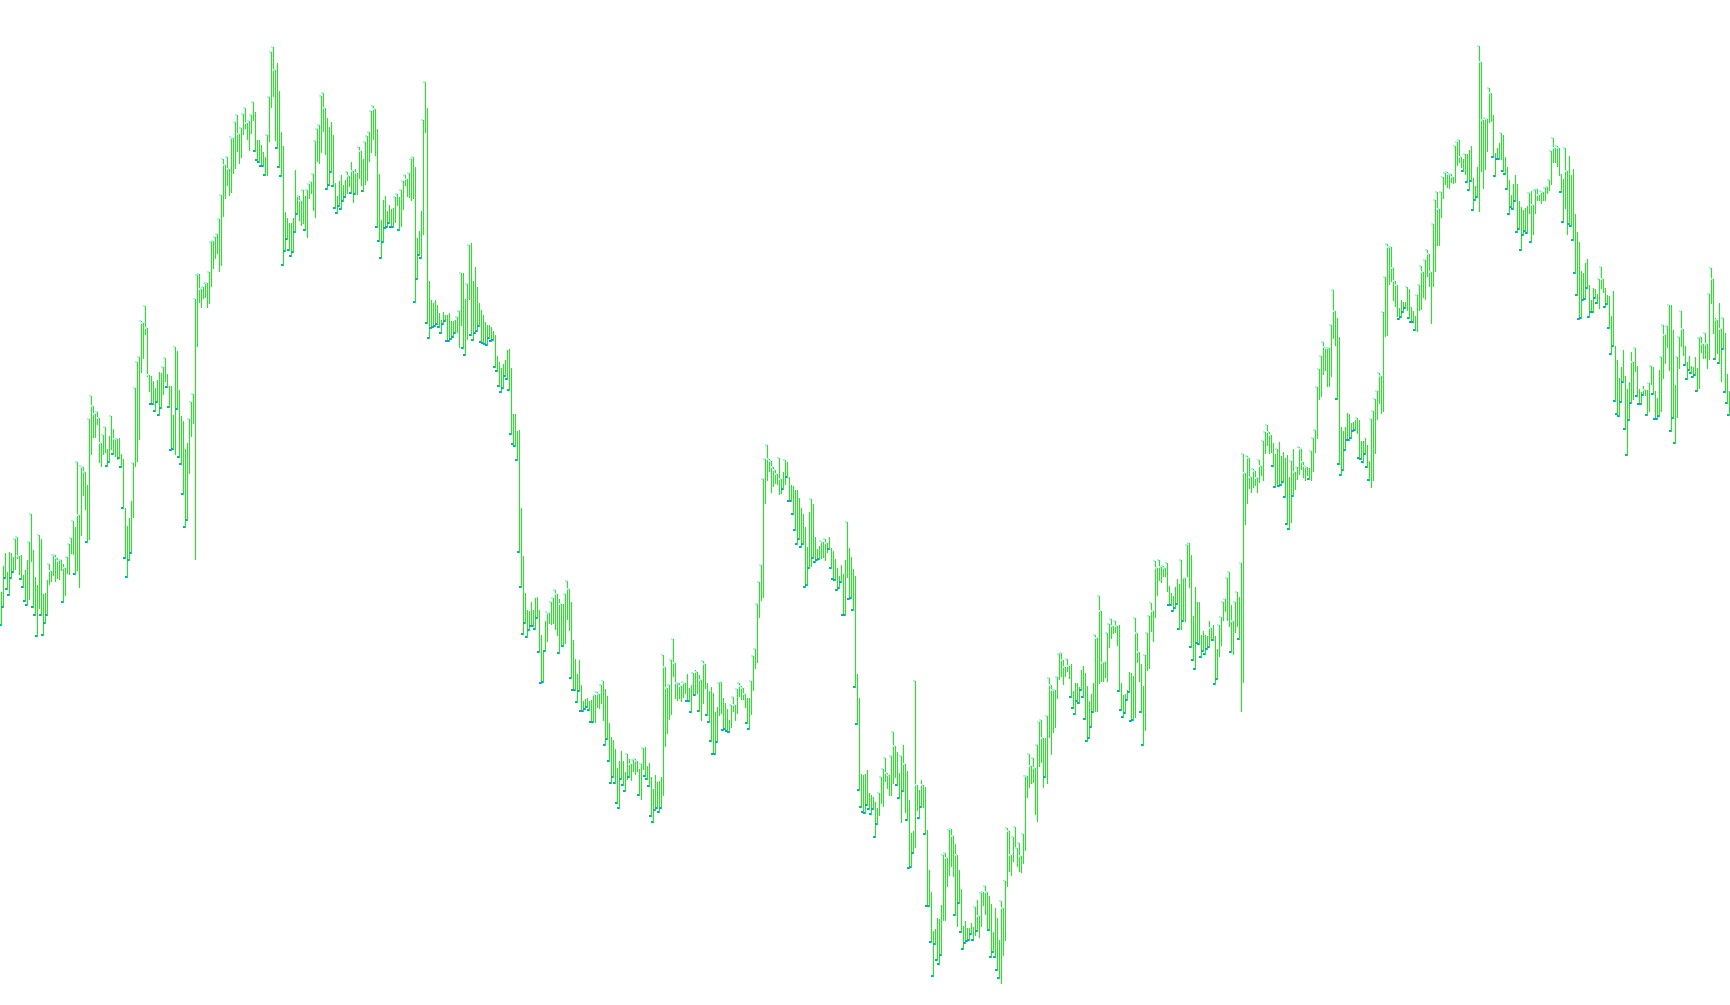
This tool is designed to provide visual cues on a trading chart to help identify price momentum and track active trade positions. Rather than cluttering the screen with complex lines, it uses specific symbols—such as dots and arrows—to signal shifts in market direction and provide real-time status updates on your current trades.
Core Logic and Functionality
The script operates based on two primary components: trend detection via moving averages and active trade monitoring.
1. Trend Momentum Tracking The indicator constantly monitors the relationship between current price trends and a specific "Moving Average" (a calculation that smooths out price fluctuations to show the general direction).
- Upward Movement: When the trend shows an upward tilt, the script places small markers at the high points of the candles.
- Downward Movement: When the trend tilts downward, it places markers at the low points of the candles.
2. Active Trade Monitoring One of the unique features of this script is its ability to "see" what trades you currently have open on that specific currency pair. It scans your active portfolio to determine if you are currently in a "Buy" or "Sell" position.
- Position Tracking: If you have an open trade, the script places a large dot on the chart. This serves as a persistent visual reminder so you can easily see at a glance which direction your current trade is oriented.
3. Dynamic Signal Alerts The script is programmed to identify specific "conflict" signals where the market trend moves against your current open position:
- Sell Protection: If you have an active Sell order but the moving average begins to trend upward, the script will place an arrow at the bottom of the candle.
- Buy Protection: If you have an active Buy order but the moving average begins to trend downward, the script will place an arrow at the top of the candle.
Summary for the User
Essentially, this tool acts as a visual assistant. It maps out the basic "flow" of the market using small dots, identifies your currently active trades with larger markers, and highlights specific moments where the price trend might be moving in the opposite direction of your current trade, providing a clear visual warning to help you manage your risk more effectively.
/*-----------------------------+
|			       |
| Shared by www.Aptrafx.com    |
|			       |
+------------------------------*/

//+------------------------------------------------------------------+
//| 5 Min RSI 12-period qual INDICATOR                               |
//+------------------------------------------------------------------+
#property copyright "Ron T"
#property link      "http://www.lightpatch.com"

#property indicator_chart_window
#property indicator_buffers 6

#property indicator_color1 White
#property indicator_color2 Red
#property indicator_color3 White
#property indicator_color4 Red
#property indicator_color5 White
#property indicator_color6 Red


//---- buffers
double Buffer1[];
double Buffer2[];
double Buffer3[];
double Buffer4[];
double Buffer5[];
double Buffer6[];

// User Input
extern double MovingAvg=10;


//+------------------------------------------------------------------+
//| Custom indicator initialization function                         |
//|------------------------------------------------------------------|

int init()
  {

   // 233 up arrow
   // 234 down arrow
   // 159 big dot
   // 158 little dot
   // 168 open square
   // 120 box with X

   SetIndexStyle(0,DRAW_ARROW);
   SetIndexBuffer(0, Buffer1);
   SetIndexArrow(0,159);  //big dot

   SetIndexStyle(1,DRAW_ARROW);
   SetIndexBuffer(1, Buffer2);
   SetIndexArrow(1,159);  //big dot

   SetIndexStyle(2,DRAW_ARROW);
   SetIndexBuffer(2, Buffer3);
   SetIndexArrow(2,158);  //little dot

   SetIndexStyle(3,DRAW_ARROW);
   SetIndexBuffer(3, Buffer4);
   SetIndexArrow(3,158);  //little dot

   SetIndexStyle(4,DRAW_ARROW);
   SetIndexBuffer(4, Buffer5);
   SetIndexArrow(4,233);  //arrow

   SetIndexStyle(5,DRAW_ARROW);
   SetIndexBuffer(5, Buffer6);
   SetIndexArrow(5,234);  //arrow

   return(0);
  }


//+------------------------------------------------------------------+
//| Custor indicator deinitialization function                       |
//+------------------------------------------------------------------+
int deinit()
  {
   int i;

   for( i=0; i<Bars; i++ ) Buffer1[i]=0;
   for( i=0; i<Bars; i++ ) Buffer2[i]=0;
   for( i=0; i<Bars; i++ ) Buffer3[i]=0;
   for( i=0; i<Bars; i++ ) Buffer4[i]=0;
   for( i=0; i<Bars; i++ ) Buffer5[i]=0;
   for( i=0; i<Bars; i++ ) Buffer6[i]=0;

   return(0);
  }


//+------------------------------------------------------------------+
//| Custom indicator iteration function                              |
//+------------------------------------------------------------------+

int start()
  {
   int      pos=Bars-100; // leave room for moving average periods

   double   cMA=0, pMA=0;

   bool     found=false;
   bool    rising=false;
   bool   falling=false;
   bool    bought=false;
   bool      sold=false;

   int      cnt=0;
   int      err=0;

   while(pos>=0)
     {

      // get 1 & 2 MA (avoid 0, as it's too noisy)
      // (possible mod - open of 0 and 1 has no noise)
      cMA=iMA(Symbol(), 0, MovingAvg, 0, MODE_LWMA, PRICE_CLOSE, pos);
      pMA=iMA(Symbol(), 0, MovingAvg, 0, MODE_LWMA, PRICE_CLOSE, pos+1);

      if (pMA<=cMA) {rising=true;  falling=false; Buffer3[pos]=High[pos];}
      if (pMA>=cMA) {rising=false; falling=true;  Buffer4[pos]=Low[pos];}

      // Does the Symbol() have an open order
      for(cnt=0;cnt<OrdersTotal();cnt++)
        {
         OrderSelect(cnt, SELECT_BY_POS, MODE_TRADES);
         if(OrderSymbol()==Symbol())
           {
            // if found, get all the trailing stoploss data
            // from bar 1 not 0
            found=true;
            if (OrderType()==0) {bought=true;  sold=false;}
            if (OrderType()==1) {bought=false; sold=true;}
            break;
           }
            else
           {
            found=false;
          }
        }


      // Draw a big dot if there
      // is an order open so user
      // can tell it's in progress
      if (found && bought)
        {
         Buffer1[pos]=High[pos];
         return(0);
        }

      if (found && sold)
        {
         Buffer2[pos]=Low[pos];
         return(0);
        }


      if (rising && sold)       //existing sell
        {
         Buffer6[pos]=Low[pos];
        }
      if (falling && bought)  // existing buy
        {
         Buffer5[pos]=High[pos];
        }

      pos--;
   }

   return(0);
  }
//+------------------------------------------------------------------+
Comments