Speed2_pips
Download script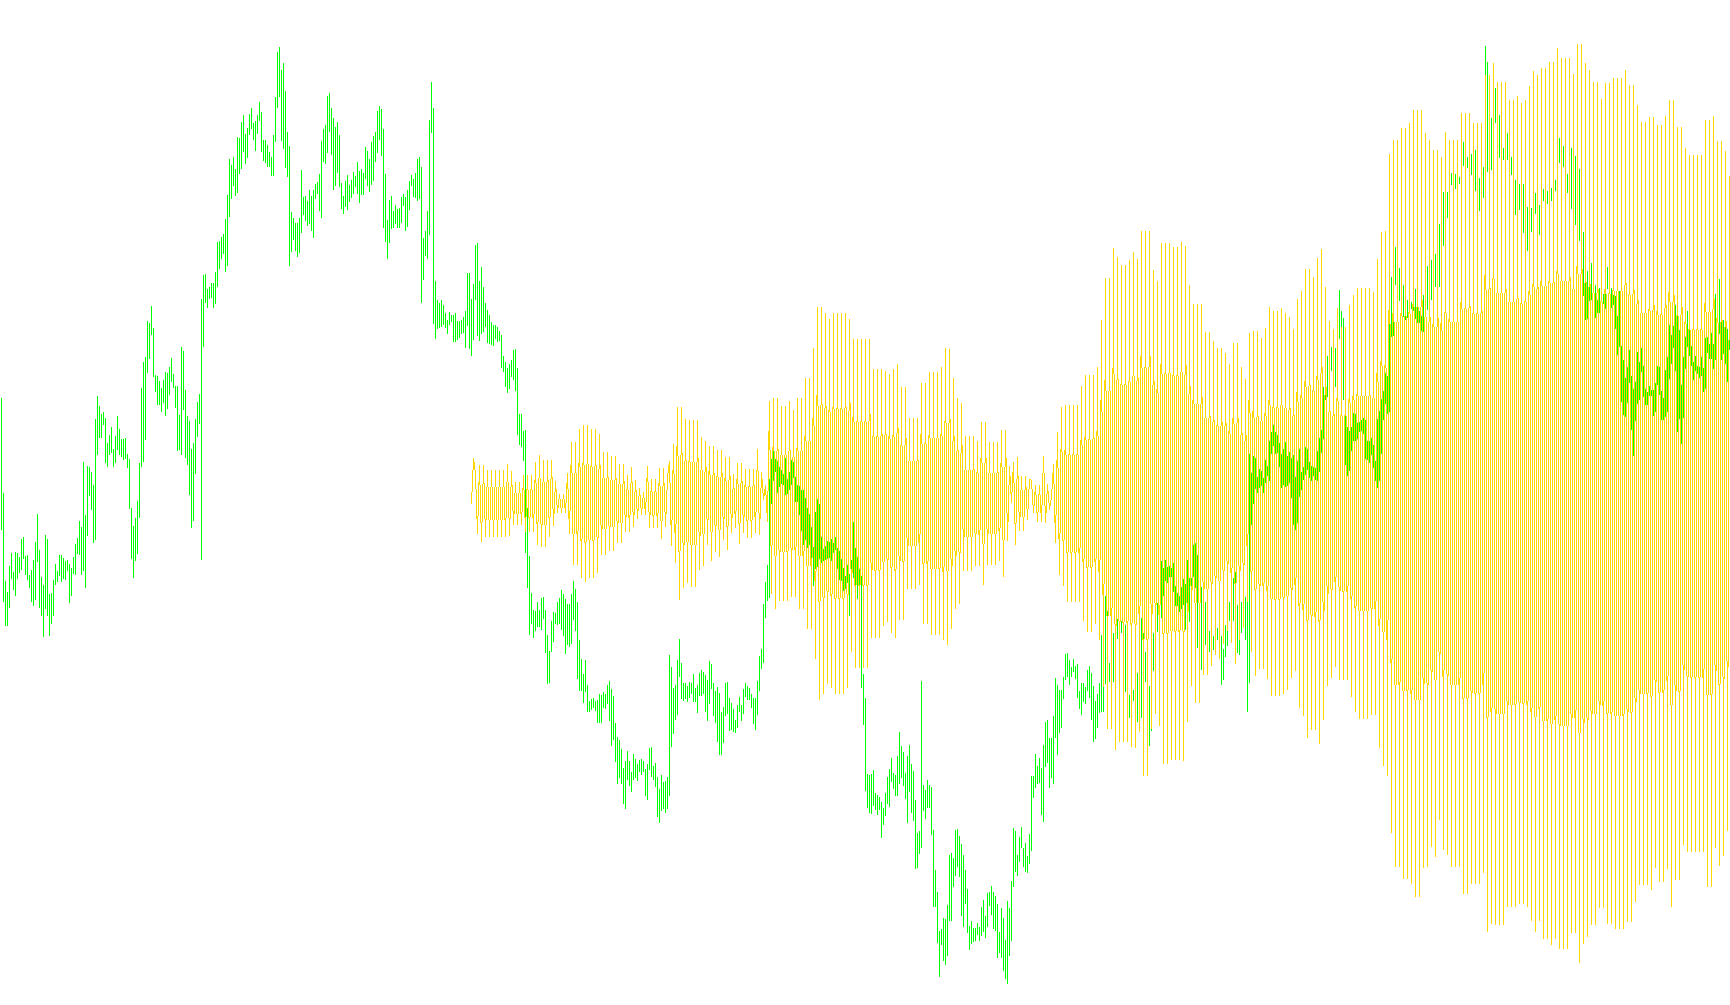
The "Speed" indicator is designed to measure and visualize the intensity of price movements by analyzing the relationship between price changes, trading volume, and specific momentum thresholds. Unlike standard indicators that simply show where a price is currently sitting, this tool focuses on the "velocity" of the market—essentially tracking how aggressively the price is moving over time.
Core Logic and Mechanics
The indicator operates by examining the history of the market bar-by-bar, looking specifically at the interaction between three main components:
- Price Momentum: The script calculates the difference in price between the current candle and the preceding one. It converts these movements into "pips" to standardize the measurement across different currency pairs or assets.
- Volume Dynamics: The logic tracks the volume of trades occurring in each period. It compares the current volume against previous periods to understand the liquidity supporting the price movement.
- Filtering Thresholds: A key feature of this script is its use of "Minimum" and "Maximum" pip settings. This allows the indicator to ignore minor market noise (small fluctuations) and only react when a significant, meaningful move occurs within a specific range that the user defines.
How the Calculation Works
For every candle on the chart, the indicator performs the following steps:
- Comparison: It identifies the price change between the current bar and the one before it.
- Validation: It checks if this price change falls within your predefined boundaries (e.g., larger than 10 pips but smaller than 300 pips). If the move is too small or excessively large, the indicator treats it as "zero" activity to keep the data clean.
- Velocity Smoothing: Once a valid move is identified, the script calculates the "net" change. It then performs a subtraction between the current value and the previous value. This creates a cumulative effect that smooths out the data, allowing you to see the acceleration or deceleration of the market trend rather than just jagged, erratic lines.
Visual Representation
The result is displayed in a separate window below your main price chart as a continuous line.
- Active Movement: When the market experiences a significant move that meets your criteria, the line will rise or fall to represent the strength of that momentum.
- Stability: When price action stays within the "noise" range (below your minimum pip setting), the indicator remains flat, helping you identify periods of consolidation where there is no significant "speed" in the market.
In summary, this tool helps traders filter out market "chatter" and visualize the true momentum of a trend, highlighting only those movements that possess enough volume and distance to be considered significant.
//+------------------------------------------------------------------+
//|                                                 Speed.mq4        |
//|                      Copyright © 2005, MetaQuotes Software Corp. |
//|                                       http://www.metaquotes.net/ |
//+------------------------------------------------------------------+
#property copyright "Copyright © 2005, MetaQuotes Software Corp."
#property link      "http://www.metaquotes.net/"

#property indicator_separate_window
#property indicator_buffers 1
#property indicator_color1 LightSeaGreen

extern int pips_min=10;
extern int pips_max=300;
//---- buffers
double ExtMapBuffer1[];
//+------------------------------------------------------------------+
//| Custom indicator initialization function                         |
//+------------------------------------------------------------------+
int init()
  {
   IndicatorShortName("(C0-C1)");
//---- indicators
   SetIndexStyle(0,DRAW_LINE);
   SetIndexBuffer(0,ExtMapBuffer1);
//----
   return(0);
  }
//+------------------------------------------------------------------+
//| Accumulation/Distribution                                        |
//+------------------------------------------------------------------+
int start()
  {
   int i,n,Bars1,counted_bars=IndicatorCounted();
   RefreshRates();
//----
   //i=0;
   //n=Bars-counted_bars-1;
   //while(i<=n)
   Bars1=Bars/2;
   i=Bars1;//Bars-counted_bars-1;
   while(i>=0)
   {
      double high0 =High[i];
      double low0  =Low[i];
      double open0 =Open[i];
      double close0=Close[i];
      double pips0=close0/Point;
      double vol0=Volume[i];

      double high1 =High[i+1];
      double low1  =Low[i+1];
      double open1 =Open[i+1];
      double close1=Close[i+1];
      double pips1=close1/Point;
      double vol1=Volume[i+1];

      double high2 =High[i+2];
      double low2  =Low[i+2];
      double open2 =Open[i+2];
      double close2=Close[i+2];
      double pips2=close2/Point;
      double vol2=Volume[i+2];

      double x1=(vol0-vol1);
      if(x1==0)x1=1;
      double x2=(vol1-vol2);
      if(x2==0)x2=1;

      double vit1=(close0-close1)/x1;
      double vit2=(close1-close2)/x2;
      //ExtMapBuffer1[i]=ExtMapBuffer1[i+1]+Volume[i];
      if (((pips0-pips1)>pips_min) && ((pips0-pips1)<pips_max) )
        ExtMapBuffer1[i]=(pips0-pips1);//(close0-close1);//vit1;  //(close-low)-(high-close);
      else
        ExtMapBuffer1[i]=0;
      /*
      if(ExtMapBuffer1[i]!=0)
      {
         double diff=high-low;
         if(0==diff)
            ExtMapBuffer1[i]=0;
         else
         {
            ExtMapBuffer1[i]/=diff;
            ExtMapBuffer1[i]*=Volume[i];
         }
      }*/
      if(i<Bars1-1)
        ExtMapBuffer1[i]-=ExtMapBuffer1[i+1];


      i--;
     }
//----
   return(0);
  }
//+------------------------------------------------------------------+
Comments