SpearmanRankCorrS
Download script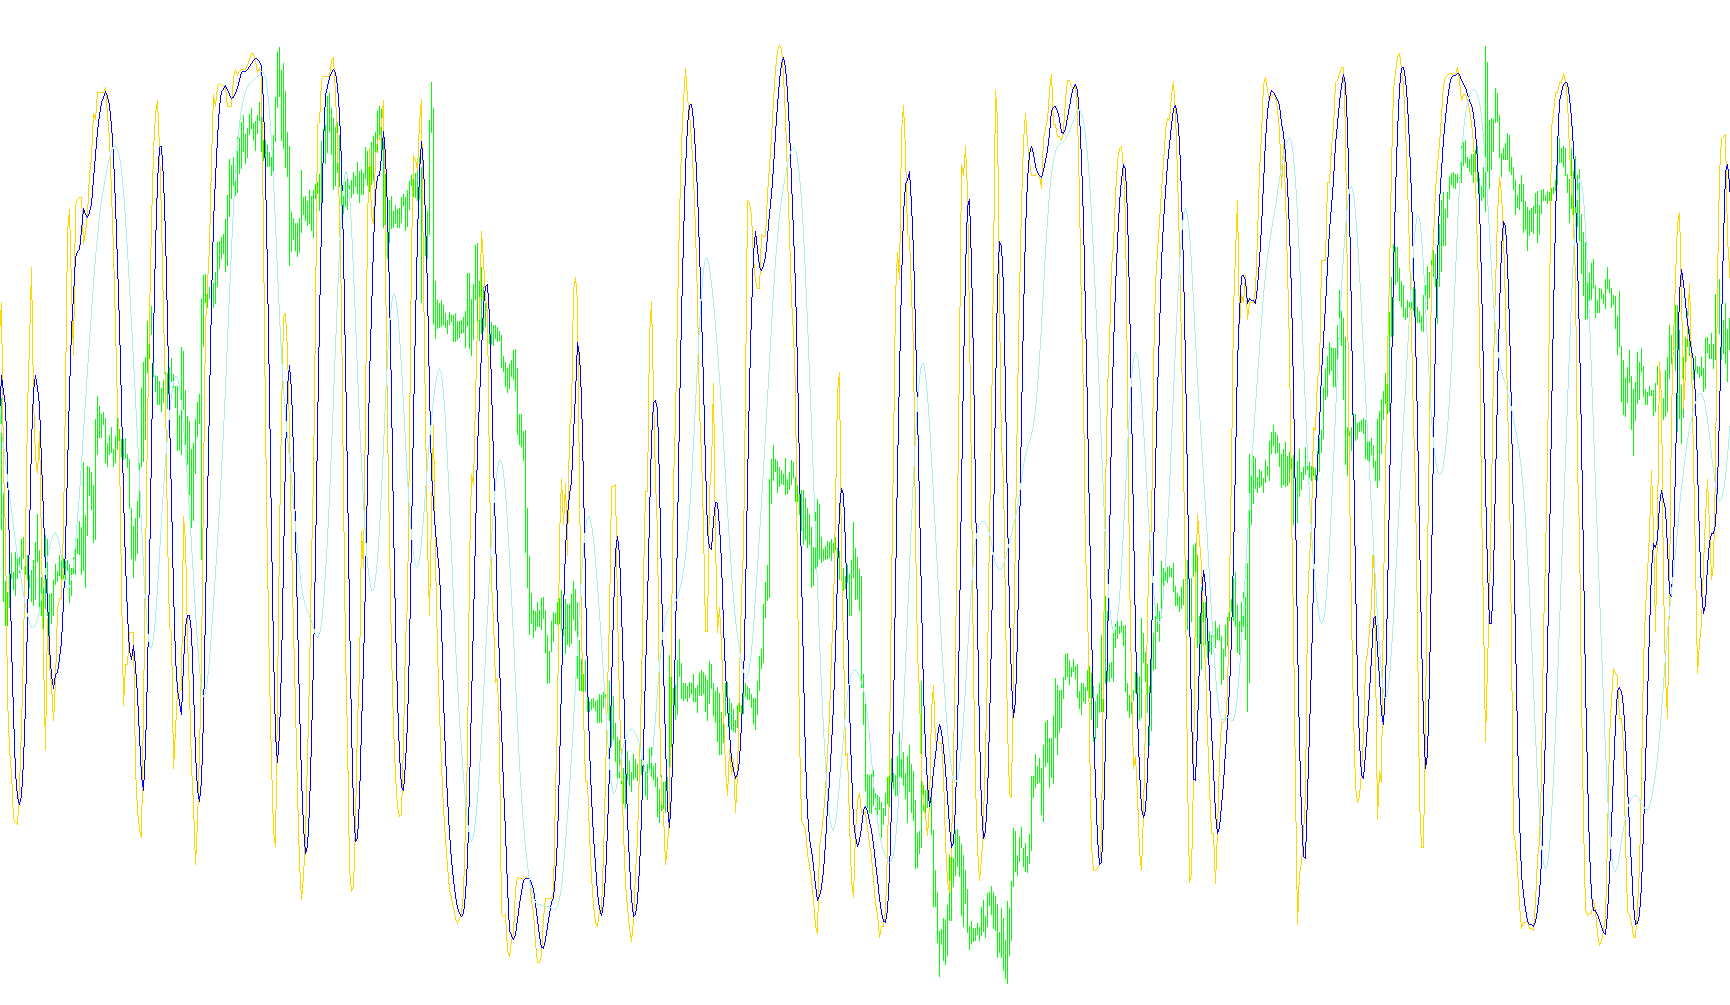
This tool is designed to analyze the relationship between price movements by looking at "ranks" rather than just raw values. Instead of focusing on how much a price changed in dollars or pips, it focuses on the relative order of those changes.
Core Logic Overview
The script operates through a three-step process to determine market trends and smooth out visual noise:
1. Ranking the Data The primary engine of this script is a ranking system. It takes a specific look-back window of historical prices (defined by your settings) and organizes them from highest to lowest (or lowest to highest, depending on your preference). By converting raw prices into ranks, the tool removes "outliers"—those sudden, massive price spikes that might normally skew a standard average. This allows the script to see the underlying structure of the movement rather than just reacting to extreme volatility.
2. Calculating Correlation Once the prices are ranked, the script applies the Spearman Rank Correlation formula. This mathematical calculation measures how closely the sequence of price ranks follows a consistent pattern.
- A high positive correlation suggests a steady, consistent upward trend.
- A high negative correlation suggests a steady, consistent downward trend.
- Values near zero indicate a market that is moving randomly without a clear directional preference.
3. Multi-Layer Smoothing To make the data easier for a human trader to read, the script does not just show the raw correlation result. It passes the results through two successive "Moving Average" filters:
- The First Layer: Takes the initial correlation value and smooths it out slightly to remove minor "jitter."
- The Second Layer: Takes that already-smoothed data and runs it through a second, longer smoothing process.
Visual Representation
The result is displayed in a separate window on your chart with three distinct lines:
- The Primary Line (Lime): This is the raw Spearman Correlation. It shows the immediate relationship between price ranks.
- The Secondary Lines (Red and Yellow): These represent the smoothed versions of the correlation. Because they are processed through multiple layers of calculation, they act as "trend filters," helping you identify the broader direction of the market while ignoring the smaller, distracting fluctuations of the moment.
Summary for the User
In simple terms, this script tells you how consistently the market is moving in one direction by comparing the order of recent prices. By using a ranking system instead of raw numbers, it provides a cleaner look at "momentum" that is less affected by sudden, erratic price jumps.
//+------------------------------------------------------------------+
//|                                      SpearmenRankCorrelation.mq4 |
//|                      Copyright © 2007, MetaQuotes Software Corp. |
//|                                        http://www.metaquotes.net |
//+------------------------------------------------------------------+
// http://www.improvedoutcomes.com/docs/WebSiteDocs/Clustering/
// Clustering_Parameters/Spearman_Rank_Correlation_Distance_Metric.htm
// http://www.infamed.com/stat/s05.html
#property copyright "Copyright © 2007, MetaQuotes Software Corp."
#property link      "http://www.metaquotes.net"
//----
#property indicator_separate_window
#property indicator_buffers 3
#property indicator_color1 Lime
#property indicator_color2 Red
#property indicator_color3 Yellow

#property indicator_level1 0.8
#property indicator_level2 -0.8
//---- input parameters
extern int  rangeN = 14;
extern int  CalculatedBars = 0;
extern int  Maxrange = 30;
extern bool direction = true;
extern int SM1=5;
extern int SM2=15;

//---- buffers
double ExtMapBuffer1[];
double ExtMapBuffer2[];
double ExtMapBuffer3[];

double R2[];
double multiply;
int    PriceInt[];
int    SortInt[];
//+------------------------------------------------------------------+
//| calculate  RSP  function                                         |
//+------------------------------------------------------------------+
double SpearmenRankCorrelation(double Ranks[], int N)
  {
//----
   double res,z2;
   int i;
   for(i = 0; i < N; i++)
     {
       z2 += MathPow(Ranks[i] - i - 1, 2);
     }
   res = 1 - 6*z2 / (MathPow(N,3) - N);
//----
   return(res);
  }
//+------------------------------------------------------------------+
//| Ranking array of prices function                                 |
//+------------------------------------------------------------------+
void RankPrices(int InitialArray[])
  {
//----
   int i, k, m, dublicat, counter, etalon;
   double dcounter, averageRank;
   double TrueRanks[];
   ArrayResize(TrueRanks, rangeN);
   ArrayCopy(SortInt, InitialArray);
   for(i = 0; i < rangeN; i++)TrueRanks[i] = i + 1;
   if(direction)ArraySort(SortInt, 0, 0, MODE_DESCEND); else ArraySort(SortInt, 0, 0, MODE_ASCEND);
   for(i = 0; i < rangeN-1; i++){
       if(SortInt[i] != SortInt[i+1]) continue;
       dublicat = SortInt[i];
       k = i + 1;
       counter = 1;
       averageRank = i + 1;
         while(k < rangeN){
           if(SortInt[k] == dublicat){
               counter++;
               averageRank += k + 1;
               k++;
           }else break;
         }
       dcounter = counter;
       averageRank = averageRank / dcounter;
         for(m = i; m < k; m++)TrueRanks[m] = averageRank;
       i = k;
   }
   for(i = 0; i < rangeN; i++){
       etalon = InitialArray[i];
       k = 0;
         while(k < rangeN){
               if(etalon == SortInt[k]){
                  R2[i] = TrueRanks[k];
                  break;
               }
           k++;
         }
   }
//----
   return;
  }
//+------------------------------------------------------------------+
//| Custom indicator initialization function                         |
//+------------------------------------------------------------------+
int init()
  {
//---- indicators
   SetIndexStyle(0, DRAW_LINE);
   SetIndexBuffer(0, ExtMapBuffer1);
   SetIndexStyle(1, DRAW_LINE);
   SetIndexBuffer(1, ExtMapBuffer2);
   SetIndexStyle(2, DRAW_LINE);
   SetIndexBuffer(2, ExtMapBuffer3);

   ArrayResize(R2, rangeN);
   ArrayResize(PriceInt, rangeN);
   ArrayResize(SortInt, rangeN);
   if(Maxrange <= 0)
       Maxrange = 10;
   if(rangeN > Maxrange)
       IndicatorShortName("Decrease rangeN input!");
   else
       IndicatorShortName("Spearmen(" + rangeN + ")");
   if(CalculatedBars < 0)
       CalculatedBars = 0;
   multiply = MathPow(10, Digits);

   SetIndexDrawBegin(0,rangeN+1);
   SetIndexDrawBegin(1,rangeN+SM1+1);
   SetIndexDrawBegin(2,rangeN+SM1+SM2+1);
   IndicatorDigits(2);

//----
   return(0);
  }
//+------------------------------------------------------------------+
//| Custom indicator deinitialization function                       |
//+------------------------------------------------------------------+
int deinit()
  {
//----
   return(0);
  }
//+------------------------------------------------------------------+
//| Custom indicator iteration function                              |
//+------------------------------------------------------------------+
int start()
  {
   int counted_bars = IndicatorCounted();
//----
   if(rangeN > Maxrange)
       return(-1);
   int i, k, limit;
   if(counted_bars == 0){
       if(CalculatedBars == 0)limit = Bars - rangeN; else limit = CalculatedBars;
   }
   if(counted_bars > 0)limit = Bars - counted_bars;
   for(i = limit; i >= 0; i--){
       for(k = 0; k < rangeN; k++)PriceInt[k] = Close[i+k+1]*multiply;
       RankPrices(PriceInt);
       ExtMapBuffer1[i] = SpearmenRankCorrelation(R2,rangeN);
  }


   for(i = limit; i >= 0; i--){
      ExtMapBuffer2[i]=iMAOnArray(ExtMapBuffer1,0,SM1,0,0,i);
   }
   for(i = limit; i >= 0; i--){
      ExtMapBuffer3[i]=iMAOnArray(ExtMapBuffer2,0,SM2,0,0,i);
   }
//----
   return(0);
  }
//+------------------------------------------------------------------+
Comments