Speedometer_v1_mod_v01
Download script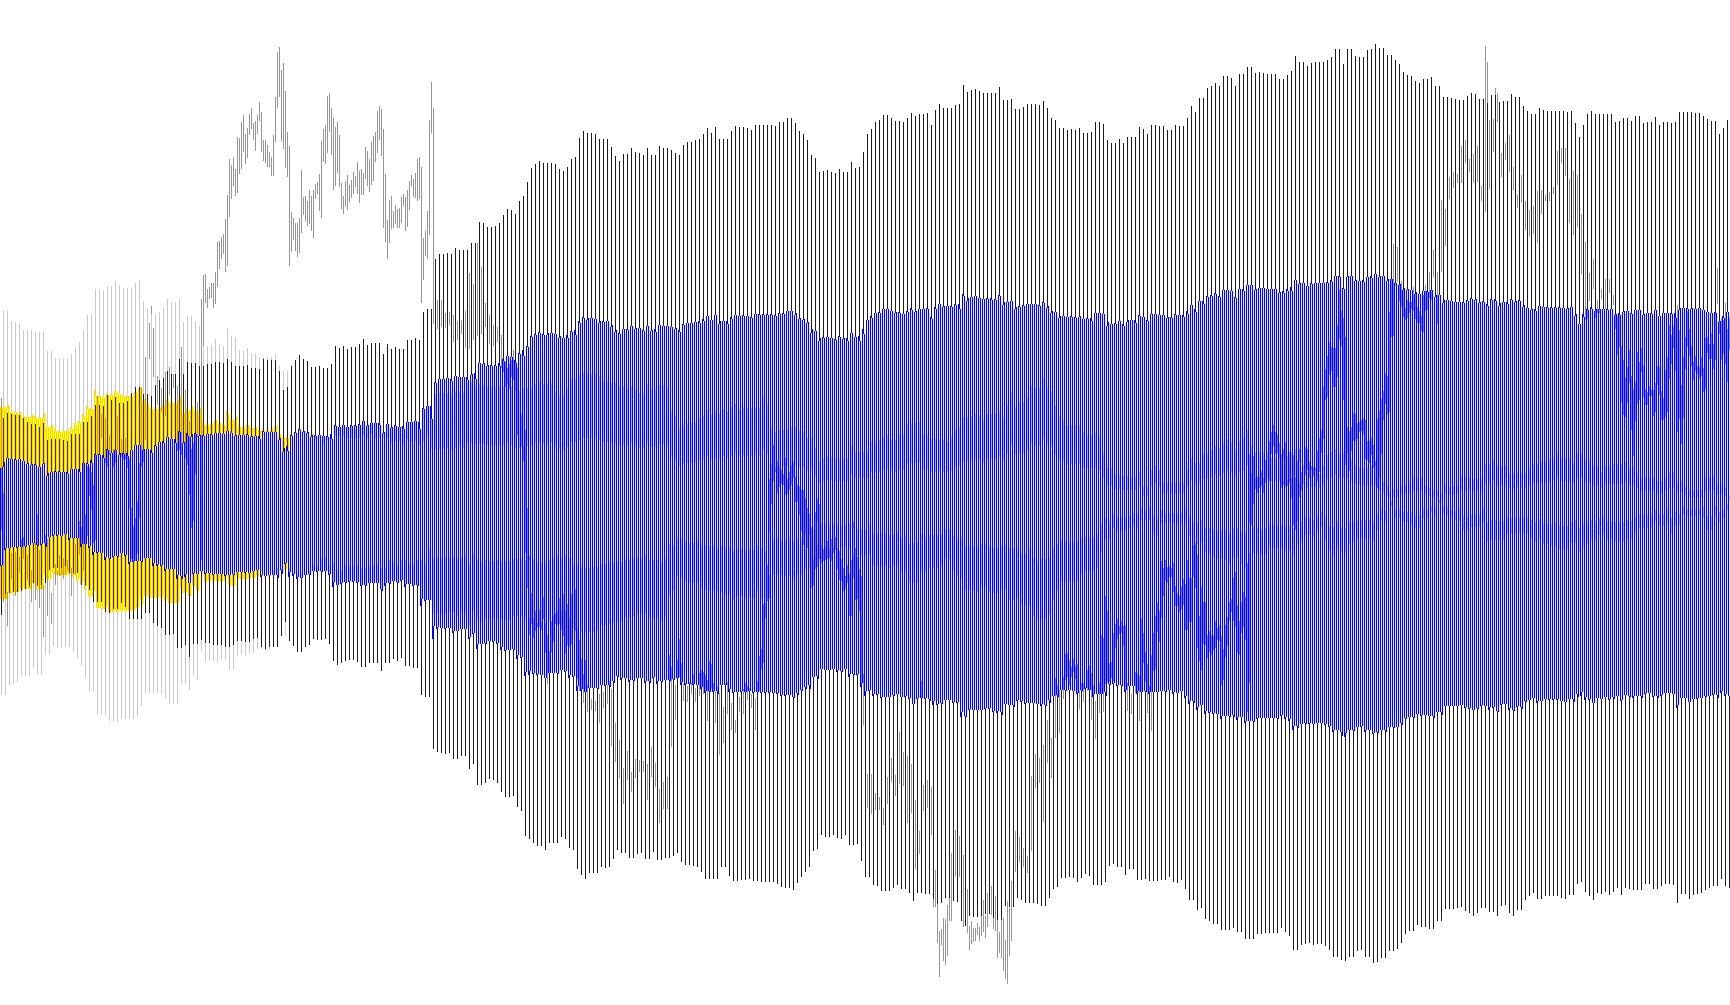
The Speedometer indicator is designed to measure and visualize the "velocity" of price movements within a trading chart. Rather than just showing where the price is, this tool focuses on how fast it is moving in a specific direction during a given timeframe.
How the Logic Works
The core functionality of the script can be broken down into three main stages:
1. Calculating Raw Velocity For every candle on your chart, the script looks at the difference between the opening price and the closing price. It then divides this movement by the amount of time that has passed. This essentially translates "price change" into a "speed" value.
- If the price moved up significantly in a short amount of time, it registers as a high positive speed.
- If the price dropped sharply, it registers as a high negative speed.
2. Separating Upward and Downward Trends To make the data easier to read, the script splits these movements into two distinct categories:
- Upward Speed: Only captures positive momentum. When the market moves up, it plots a value; when it moves down or stays flat, this value remains at zero.
- Downward Speed: Only captures negative momentum. When the market drops, it plots the speed of that decline; when moving up or staying flat, this value remains at zero.
3. Smoothing the Momentum (The "Speedometer" Effect) To prevent the indicator from looking erratic or jumpy, the script applies a calculation that compares the current speed to the previous candle's speed. By subtracting the previous value from the current one, it highlights the acceleration or deceleration of the market. This creates a smoother line that helps traders identify when a trend is gaining strength or losing steam.
Visual Summary
The indicator appears in a separate window below your main chart as two distinct lines:
- Blue Line: Represents the intensity and speed of upward price action.
- Red Line: Represents the intensity and speed of downward price action.
By observing these lines, you can visually identify "bursts" of activity—where the market is moving with high velocity—versus periods of stagnation or slow consolidation.
//+------------------------------------------------------------------+
//|                                               Speedometer_v1.mq4 |
//|                                  Copyright © 2006, Forex-TSD.com |
//|                         Written by IgorAD,igorad2003@yahoo.co.uk |
//|            http://finance.groups.yahoo.com/group/TrendLaboratory |
//+------------------------------------------------------------------+
#property copyright "Copyright © 2006, Forex-TSD.com "
#property link      "http://www.forex-tsd.com/"

#property indicator_separate_window
#property indicator_buffers 2
#property indicator_color1 DodgerBlue
#property indicator_color2 Tomato

#property indicator_width1 1
#property indicator_width2 1

#property indicator_level1 0

extern int SpeedLimit=0;

double UpSpeed[];
double DnSpeed[];

//double price,prevprice,MaxUpSpeed=-1;

int init()
{
   string short_name;

   SetIndexStyle(0,DRAW_LINE);
   SetIndexBuffer(0,UpSpeed);

   SetIndexStyle(1,DRAW_LINE);
   SetIndexBuffer(1,DnSpeed);

   short_name="Speedometer";
   IndicatorShortName(short_name);
   SetIndexLabel(0,"Up");
   SetIndexLabel(1,"Down");

return(0);
}

int start()
{
   int    i, counted_bars=IndicatorCounted(),limit;

   if ( counted_bars > 0 )  limit=Bars-counted_bars;
   if ( counted_bars < 0 )  return(0);
   if ( counted_bars ==0 )  limit=Bars-1;

   //for(i=0;i<limit;i++)
   //for(i=limit;i>0;i--)
   i=limit;
   while(i>=0)
   {
   double dTime = Period();
   if (i==0) dTime = (TimeCurrent()-Time[i])/60.0;

   if(dTime > 0)
   double Speed = (Close[i]-Open[i])/dTime/Point;

   if ( Speed >= 0) {UpSpeed[i]=Speed; DnSpeed[i] = 0;}
   else if ( Speed<0) {DnSpeed[i] = Speed; UpSpeed[i] = 0;}


   UpSpeed[i]-=UpSpeed[i+1];
   DnSpeed[i]-=DnSpeed[i+1];
    i--;
   }

//----------
//   string Message;
//   if ( SpeedLimit>0 && UpSpeed[0] > SpeedLimit && Volume[0]>1/*&& !UpTrendAlert*/)
//	{
//	Message = " "+Symbol()+" M"+Period()+": Exceeding of Speed Limit - BUY";
//	Alert (Message);
	//UpTrendAlert=true; DownTrendAlert=false;
//	}
//	if ( SpeedLimit>0 && DnSpeed[0] < -SpeedLimit && Volume[0]>1/*&& !DownTrendAlert*/)
//	{
//	Message = " "+Symbol()+" M"+Period()+": Exceeding of Speed Limit - SELL";
//	Alert (Message);
	//DownTrendAlert=true; UpTrendAlert=false;
//	}


//----


return(0);
}
Comments