Speed4
Download script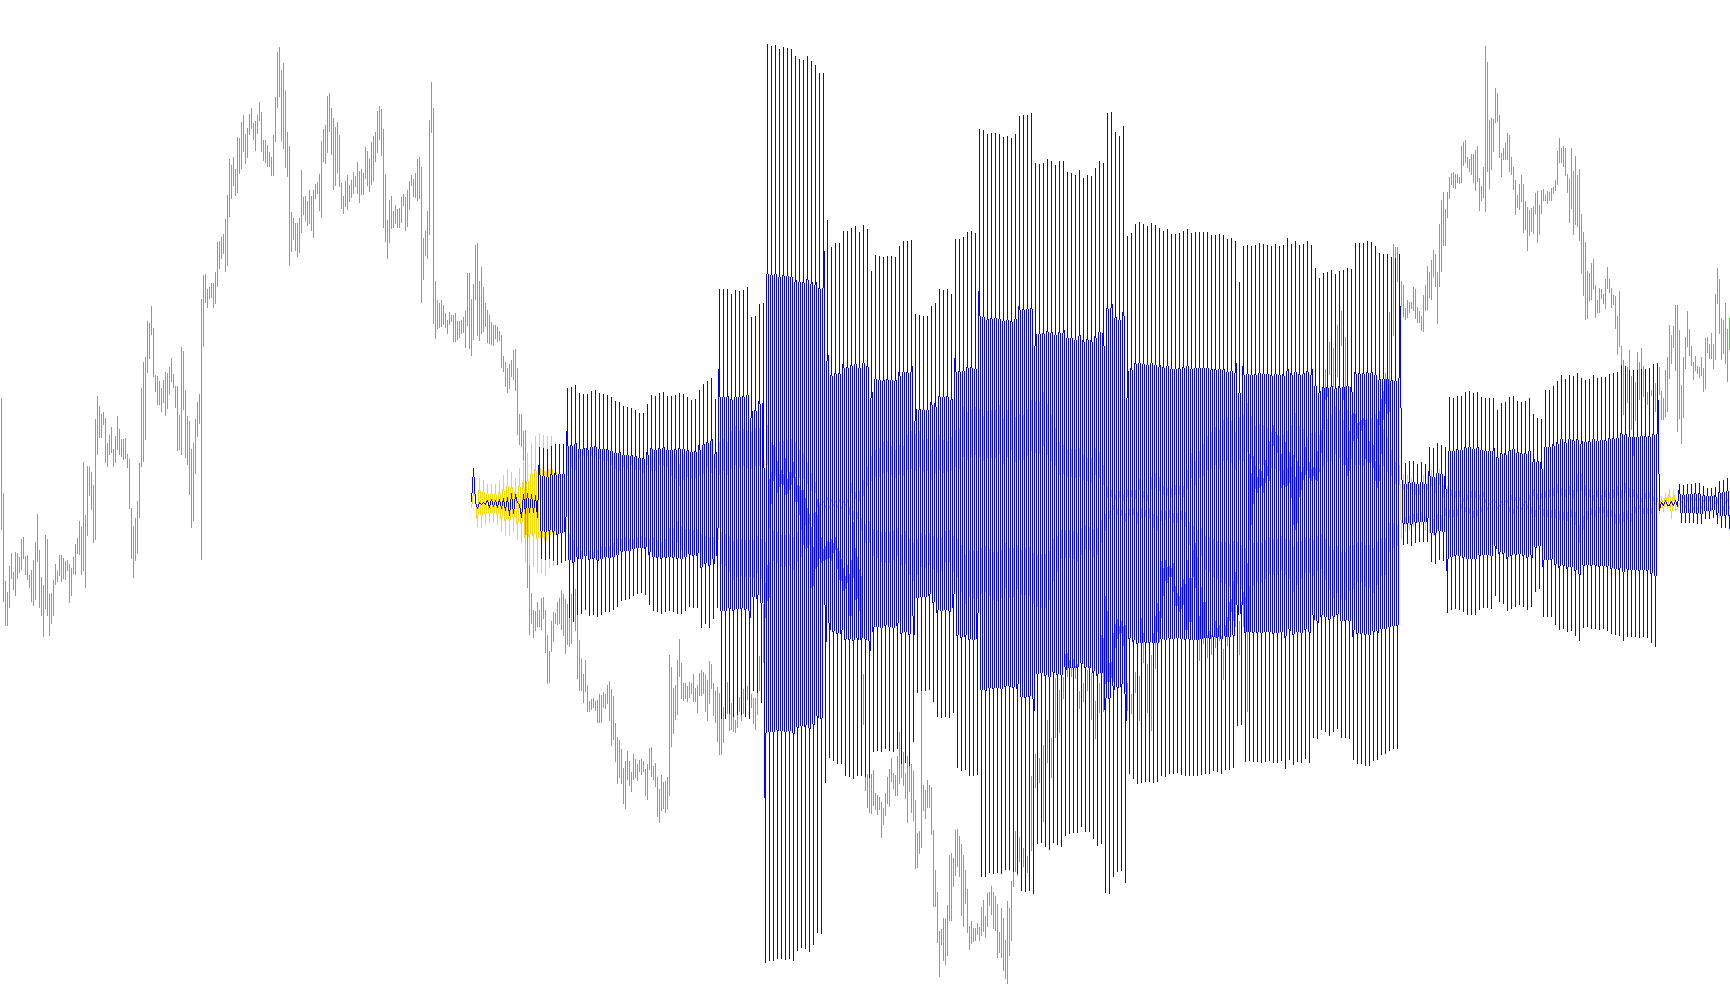
This technical tool is designed to measure the momentum and "speed" of price movements by analyzing the relationship between price changes, trading volume, and historical trends. Instead of simply looking at where the price is currently, this indicator evaluates how aggressively it reached that point relative to previous activity.
Core Logic and Methodology
The script operates by examining three consecutive data points (candles) on a chart to identify patterns in market behavior. Here is a breakdown of how it processes this information:
1. Volume and Price Delta Analysis The logic begins by calculating the change in trading volume between consecutive periods. It identifies how much "effort" (volume) was put into price movements. If there is no change in volume, the script applies a baseline value to ensure the calculation can continue without interruption.
2. Velocity Calculation By dividing the difference in closing prices by the change in volume, the tool determines a "velocity" metric. This helps distinguish between a price move driven by high-intensity trading and one that occurred on very low activity. It essentially seeks to determine if the market is moving quickly or slowly relative to the amount of trading taking place.
3. Range Evaluation The script also looks at the distance between the highest and lowest prices reached during specific periods (the "range"). This allows the tool to contextualize whether a price move was a steady climb, a volatile swing, or a concentrated burst of activity.
4. Momentum Smoothing To provide a readable output, the indicator calculates the differences between these current velocity metrics and the previous ones. By subtracting the values of preceding periods from current ones, it isolates the "acceleration" or "deceleration" of the market.
Visual Representation
The final result is plotted as two distinct lines in a separate window below your main chart:
- Primary Momentum: This line tracks the raw difference in price changes.
- Velocity Modifier: This line represents the calculated velocity scaled by a factor of 100, providing a clearer visual representation of how fast the market is reacting to new information.
In summary, this tool acts as a momentum gauge. It helps traders see not just that the price is moving, but how fast it is moving in relation to the volume of trades supporting that move, helping to identify shifts in market strength before they become obvious on a standard price chart.
//+------------------------------------------------------------------+
//|                                                 Speed.mq4        |
//|                      Copyright © 2005, MetaQuotes Software Corp. |
//|                                       http://www.metaquotes.net/ |
//+------------------------------------------------------------------+
#property copyright "Copyright © 2005, MetaQuotes Software Corp."
#property link      "http://www.metaquotes.net/"

#property indicator_separate_window
#property indicator_buffers 2
#property indicator_color1 LightSeaGreen
#property indicator_color2 Red
extern int pips_min=10;
extern int pips_max=300;
//---- buffers
double ExtMapBuffer1[];
double ExtMapBuffer2[];
//+------------------------------------------------------------------+
//| Custom indicator initialization function                         |
//+------------------------------------------------------------------+
int init()
  {
   IndicatorShortName("Speed4(C0-C1)");
//---- indicators
   SetIndexStyle(0,DRAW_LINE);
   SetIndexBuffer(0,ExtMapBuffer1);
   SetIndexStyle(1,DRAW_LINE);
   SetIndexBuffer(1,ExtMapBuffer2);

//----
   return(0);
  }
//+------------------------------------------------------------------+
//| Accumulation/Distribution                                        |
//+------------------------------------------------------------------+
int start()
  {
   int i,n,Bars1,counted_bars=IndicatorCounted();
   RefreshRates();
//----
   //i=0;
   //n=Bars-counted_bars-1;
   //while(i<=n)
   Bars1=Bars/2;
   i=Bars1;//Bars-counted_bars-1;
   while(i>=0)
   {
      double high0 =High[i];
      double low0  =Low[i];
      double open0 =Open[i];
      double close0=Close[i];
      double pips0=close0/Point;
      double vol0=Volume[i];

      double high1 =High[i+1];
      double low1  =Low[i+1];
      double open1 =Open[i+1];
      double close1=Close[i+1];
      double pips1=close1/Point;
      double vol1=Volume[i+1];

      double high2 =High[i+2];
      double low2  =Low[i+2];
      double open2 =Open[i+2];
      double close2=Close[i+2];
      double pips2=close2/Point;
      double vol2=Volume[i+2];


      double x1=(vol0-vol1);
      if(x1==0)x1=1;
      double x2=(vol1-vol2);
      if(x2==0)x2=1;

      double vit1=(close0-close1)/x1;
      double vit2=(close1-close2)/x2;

      double vit3=(high0-low0)/x1;
      double vit4=(high1-low1)/x2;
      //ExtMapBuffer1[i]=ExtMapBuffer1[i+1]+Volume[i];
      ExtMapBuffer1[i]=(close0-close1);//iMACD(NULL,0,14,26,9,PRICE_CLOSE,MODE_MAIN,0)-iMACD(NULL,0,14,26,9,PRICE_CLOSE,MODE_MAIN,1);//buy //-vit4;  //(close-low)-(high-close);
      ExtMapBuffer2[i]=vit1*100;//-(iMACD(NULL,0,14,26,9,PRICE_CLOSE,MODE_MAIN,0)-iMACD(NULL,0,14,26,9,PRICE_CLOSE,MODE_MAIN,1));//sell
      /*
      if(ExtMapBuffer1[i]!=0)
      {
         double diff=high-low;
         if(0==diff)
            ExtMapBuffer1[i]=0;
         else
         {
            ExtMapBuffer1[i]/=diff;
            ExtMapBuffer1[i]*=Volume[i];
         }
      }*/
      if(i<Bars1-1)
      {
        ExtMapBuffer1[i]-=ExtMapBuffer1[i+1];
        ExtMapBuffer2[i]-=ExtMapBuffer2[i+1];
      }


      i--;
     }
//----
   return(0);
  }
//+------------------------------------------------------------------+
Comments