Solar_Wind_clean_X
Download script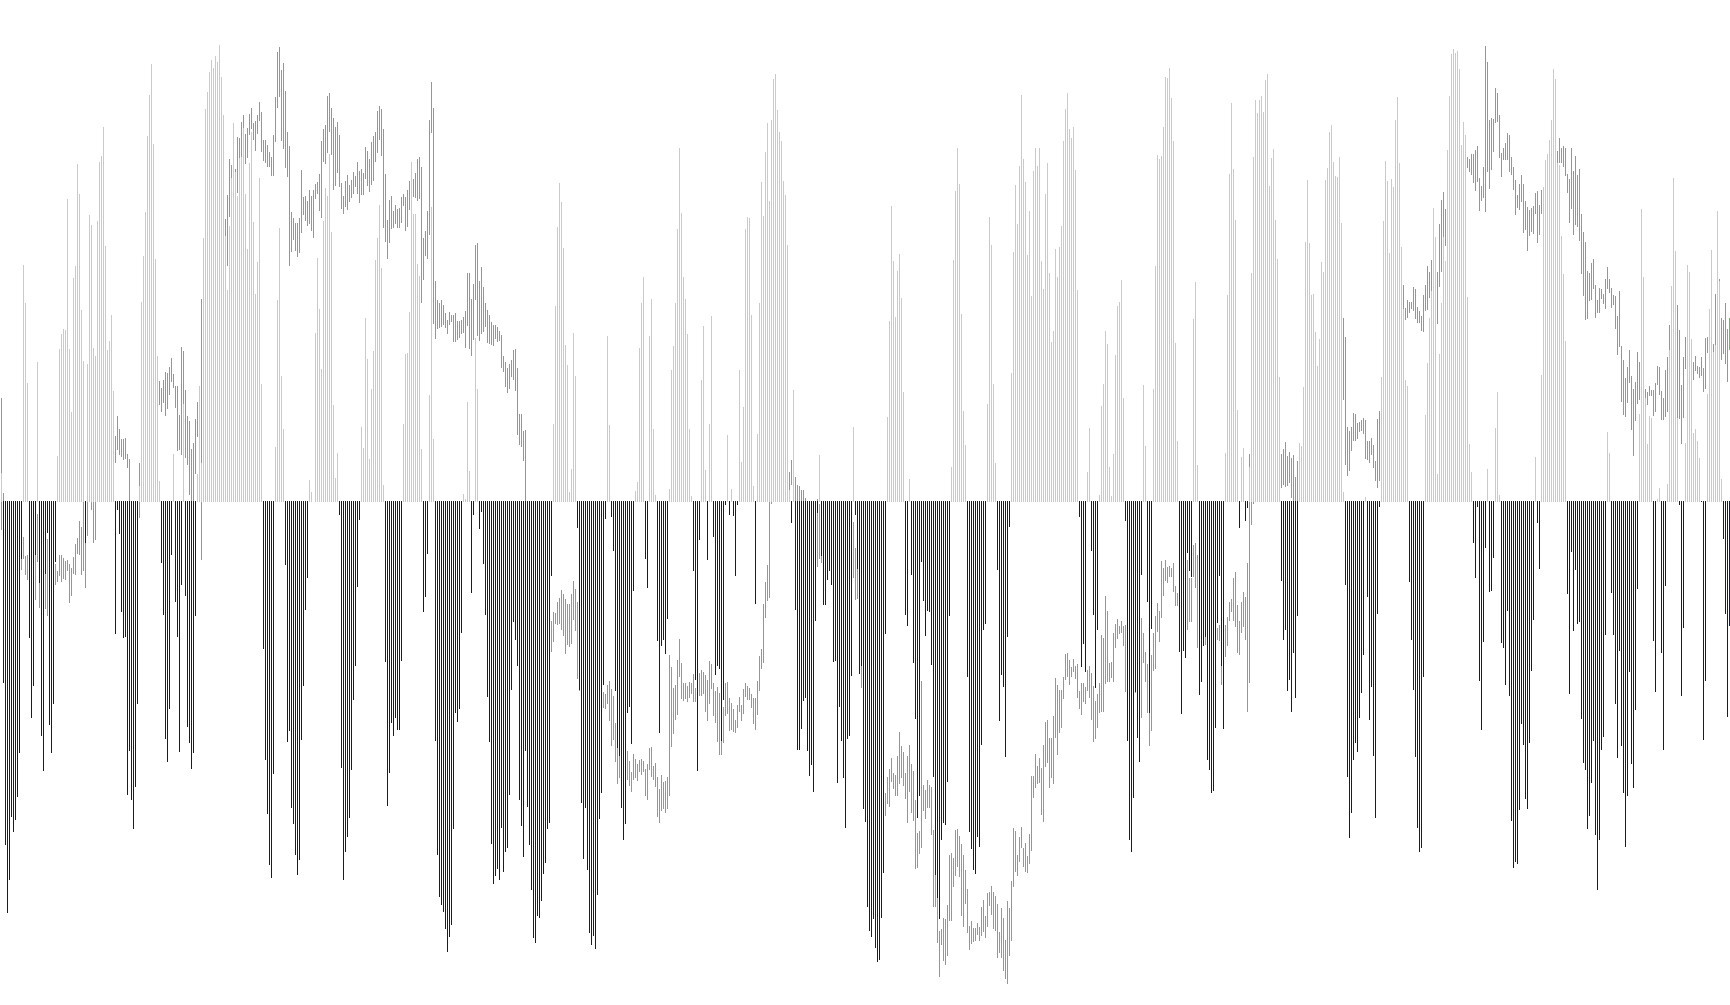
This technical indicator, titled Solar Wind Clean, is designed to provide traders with a visual representation of market momentum and price positioning. It functions by analyzing the relationship between current price action and recent historical extremes to identify trends and potential shifts in market direction.
Core Logic & Methodology
The indicator operates through a three-stage processing sequence to turn raw market data into a readable visual signal:
1. Relative Price Positioning The tool first looks at a specific window of time (defined by the "Period" setting) to identify the highest high and the lowest low reached during that interval. It then calculates where the current price sits relative to those extremes. By determining if the price is closer to the top, the bottom, or the middle of this range, the script creates a numerical value representing the "strength" of the current movement.
2. Mathematical Transformation (Fisher Transform) To make this data more useful for human interpretation, the script applies a mathematical transformation known as a Fisher Transform. Raw price movements can often be erratic; this calculation stabilizes the data by normalizing it. It essentially "squashes" extreme outliers and expands the middle range, making it easier to identify when a trend is reaching an exhausted state or when a significant reversal is likely to occur.
3. Smoothing and Visualization Because raw market data can be "noisy" (featuring constant small fluctuations), the script applies a smoothing layer (defined by the "Smoozing" setting). This filters out the minor distractions and highlights the primary trend.
How to Read the Results
The final output is displayed as a histogram in a separate window below the main price chart:
- Trend Direction: The indicator distinguishes between positive and negative momentum.
- Visual Cues: When the smoothed value moves into positive territory, it typically indicates bullish momentum (upward trend), while negative values indicate bearish momentum (downward trend).
- Signal Clarity: By using two distinct colors (Lime and Red), the tool allows traders to quickly identify at a glance whether the current market sentiment is leaning toward an increase or a decrease in value.
In summary, this script takes complex price data, measures its position within recent highs and lows, transforms it into a standardized format, smooths out the "noise," and presents it as a clear visual guide for identifying market direction.
//+------------------------------------------------------------------+
//| Solar wind clean XXX(based on Solar wind clean  (FisherTransform)|
//| revised by Mladen    Copyright © 2005, MetaQuotes Software Corp. |
//| ForexTSD mladen nittany  mod fxbs  ki http://www.metaquotes.net/ |
//+------------------------------------------------------------------+
#property  copyright "Copyright © 2005,  MetaQuotes Software Corp."
#property  link      "http://www.metaquotes.net/ www.ForexTSD.com"

//---- indicator settings

#property  copyright ""
#property  link      ""

#property  indicator_separate_window
#property  indicator_buffers 2
#property  indicator_color1  Lime
#property  indicator_color2  Red

extern int period    = 10;
extern int smoozing  = 2;

double         ExtBuffer0[];
double         ExtBuffer1[];
double         ExtBuffer2[];
double         Value[];
double         ExtBuffer3[];


int init()
{
   IndicatorBuffers(5);
   SetIndexBuffer(0,ExtBuffer1);
   SetIndexBuffer(1,ExtBuffer2);
   SetIndexBuffer(2,ExtBuffer0);
   SetIndexBuffer(3,Value);
   SetIndexBuffer(4,ExtBuffer3);

   SetIndexStyle(0,DRAW_HISTOGRAM);
   SetIndexStyle(1,DRAW_HISTOGRAM);


//---  mod to show currency pair and Period by nittany1 forex-tsd
//     IndicatorShortName("SOLAR WIND Clean("+Symbol()+","+period+")");

   IndicatorShortName("SOLARWIND CleanX ("+period+")("+smoozing+")");
   IndicatorDigits(Digits+1);


   return(0);
}


int start()
{

   int   limit;
   int   counted_bars=IndicatorCounted();

   if(counted_bars>0) counted_bars--;
           limit=Bars-counted_bars;

   for(int i=limit; i>=0; i--)
   {
      double MaxH  = High[iHighest(NULL,0,MODE_HIGH,period,i)];
      double MinL  = Low [iLowest( NULL,0,MODE_LOW, period,i)];
      double price = (High[i]+Low[i])/2;
      if (MaxH!=MinL)
              Value[i] = 0.33*2*((price-MinL)/(MaxH-MinL)-0.5);


      else  Value[i] = 0.00;
            Value[i] = MathMin(MathMax(Value[i],-0.999),0.999);
            ExtBuffer0[i]=0.5*MathLog((1+Value[i])/(1-Value[i]));

     }

         for( i=limit; i>=0; i--)
     {

            ExtBuffer3[i]=iMAOnArray(ExtBuffer0,0,smoozing,0,MODE_EMA,i);


      //
      //
      //
      //
      //

      if(ExtBuffer3[i]<0)
      {
         ExtBuffer2[i]=ExtBuffer3[i];
         ExtBuffer1[i]=0.0;
      }
      else
      {
         ExtBuffer1[i]=ExtBuffer3[i];
         ExtBuffer2[i]=0.0;
      }
   }
   return(0);
}
Comments