SpearmenRankCorrelation_NTF_variant3colors
Download script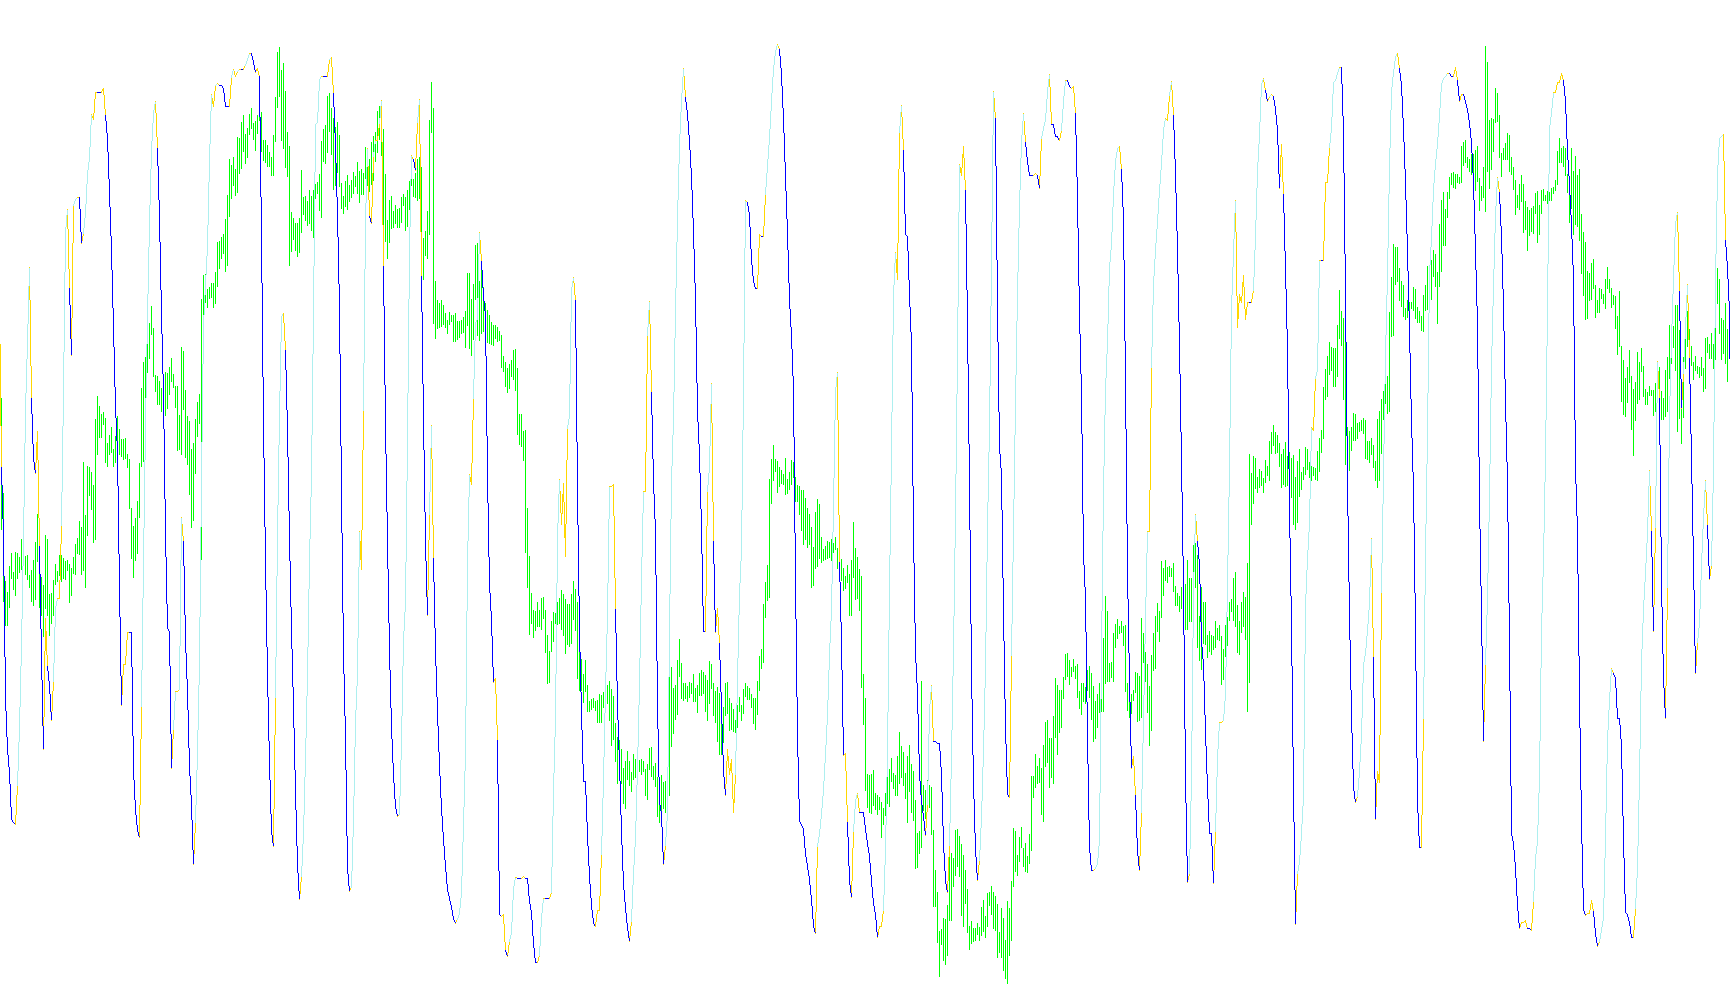
This tool is designed to analyze market trends by measuring the statistical relationship between price movements across different timeframes. Rather than just looking at raw price action, it uses a mathematical correlation method to determine how consistently assets are moving in a specific direction over a defined period.
Core Logic and Functionality
Multi-Timeframe Synchronization The primary strength of this script is its ability to "look ahead" into higher timeframes while you are viewing a smaller chart. It automatically calculates the relationship between your current view (e.g., 1-minute or 5-minute charts) and a larger timeframe specified by the user. This allows traders to see how the "big picture" trend is influencing the immediate price action.
Correlation Analysis The script utilizes a specific statistical ranking system to evaluate market trends. Instead of simply checking if the price went up or down, it assesses the strength and consistency of that movement over a set number of bars (the range). By calculating this correlation, the tool provides a clearer picture of whether a trend is stable or erratic.
Dynamic Trend Identification The script processes these correlations to generate visual signals on your chart. It compares current correlation data against previous data points to identify momentum:
- Trend Confirmation: When the correlation values indicate consistent movement in a specific direction compared to the previous period, the script highlights this trend visually.
- Visual Differentiation: The logic separates different types of movements into distinct visual outputs (represented by different colors/lines). This helps users quickly distinguish between strengthening trends and shifting market conditions.
Automated Calculation For the user, the complexity of these mathematical comparisons is handled automatically. The script handles the heavy lifting of:
- Identifying the correct historical bars for both timeframes.
- Mapping out the correlation values across the chart history.
- Filtering out "noise" to ensure that only significant trend movements are highlighted.
Summary for the User
Think of this tool as a high-level "trend filter." It looks at the bigger market movements and translates them onto your current chart, showing you not just where the price is going, but how strongly and consistently it is moving there based on historical statistical patterns.
//+------------------------------------------------------------------+
//|                                  SpearmenRankCorrelation_NTF.mq4 |
//|                                                                * |
//|                                                                * |
//+------------------------------------------------------------------+
#property copyright "*"
#property link      "*"

#property indicator_separate_window
#property indicator_buffers 3
#property indicator_color1 Yellow
#property indicator_color2 Red
#property indicator_color3 Lime

#property indicator_level1 0.8
#property indicator_level2 -0.8
extern int  NextTimeFrame=60;
extern int  rangeN = 14;
extern int  CalculatedBars = 0;
extern int  Maxrange = 30;
extern bool direction = true;
//extern int SM1=5;
//extern int SM2=15;


//---- buffers
double ExtMapBuffer1[];
double ExtMapBuffer2[];
double ExtMapBuffer3[];
//+------------------------------------------------------------------+
//| Custom indicator initialization function                         |
//+------------------------------------------------------------------+
int init()
  {
//---- indicators
   SetIndexStyle(2,DRAW_LINE);
   SetIndexBuffer(2,ExtMapBuffer1);
   SetIndexStyle(1,DRAW_LINE);
   SetIndexBuffer(1,ExtMapBuffer2);
   //SetIndexStyle(2,DRAW_LINE);
   SetIndexStyle(0,DRAW_LINE);
   SetIndexBuffer(0,ExtMapBuffer3);
//---óñòàíîâêà íóëåâûõ çíà÷åíèé
   SetIndexEmptyValue(0,EMPTY_VALUE);
   SetIndexEmptyValue(1,EMPTY_VALUE);
   SetIndexEmptyValue(2,EMPTY_VALUE);
//----
   return(0);
  }
//+------------------------------------------------------------------+
//| Custom indicator deinitialization function                       |
//+------------------------------------------------------------------+
int deinit()
  {
//----

//----
   return(0);
  }
//+------------------------------------------------------------------+
//| Custom indicator iteration function                              |
//+------------------------------------------------------------------+
int start()
  {
   datetime daytimes[];
   static bool err;

//---
   int p = Period();
   int k = NextTimeFrame/p;
//---
   ArrayCopySeries(daytimes,MODE_TIME,Symbol(),NextTimeFrame);
      if(GetLastError()==4066){
         err=true;
         return(0);
      }
	int limit=Bars-IndicatorCounted();//êîëè÷åñòâî áàðîâ äëÿ êîòîðûõ íå ïðîâåäåí ðàñ÷åò èíäèêàòîðà
      if(err){
         err=false;
         limit=Bars;
      }
	int NTFBarNum=iBarShift(NULL,NextTimeFrame,Time[limit-1],false);
	datetime NTFTime=iTime(NULL,NextTimeFrame,NTFBarNum);
	limit=iBarShift(NULL,0,NTFTime)+1;

	for(int i=limit-1;i>=0;i--){
      int BarNum=iBarShift(NULL,NextTimeFrame,Time[i],false);
      //ExtMapBuffer1[i]=iCustom(NULL,NextTimeFrame,"SpearmanRankCorrS",rangeN,CalculatedBars,Maxrange,direction,SM1,SM2,0,BarNum);
      //ExtMapBuffer3[i]=iCustom(NULL,NextTimeFrame,"SpearmanRankCorrS",rangeN,CalculatedBars,Maxrange,direction,SM1,SM2,0,BarNum);
      //ExtMapBuffer3[i]=iCustom(NULL,NextTimeFrame,"SpearmanRankCorrS",rangeN,CalculatedBars,Maxrange,direction,SM1,SM2,2,BarNum);
      ExtMapBuffer3[i]=iCustom(NULL,NextTimeFrame,"SpearmanRankCorr",rangeN,CalculatedBars,Maxrange,direction,0,BarNum);
      if(ExtMapBuffer3[i+k]<=ExtMapBuffer3[i]){ExtMapBuffer1[i]=ExtMapBuffer3[i];ExtMapBuffer2[i]=EMPTY_VALUE;}
      if(ExtMapBuffer3[i+k]>=ExtMapBuffer3[i]){ExtMapBuffer2[i]=ExtMapBuffer3[i];ExtMapBuffer1[i]=EMPTY_VALUE;}
      //if(ExtMapBuffer3[i+k]==ExtMapBuffer3[i]){ExtMapBuffer2[i]=ExtMapBuffer2[i+k];ExtMapBuffer1[i]=ExtMapBuffer1[i+k];}

   }
   return(0);
  }
//+------------------------------------------------------------------+
Comments