SolarWind_2
Download script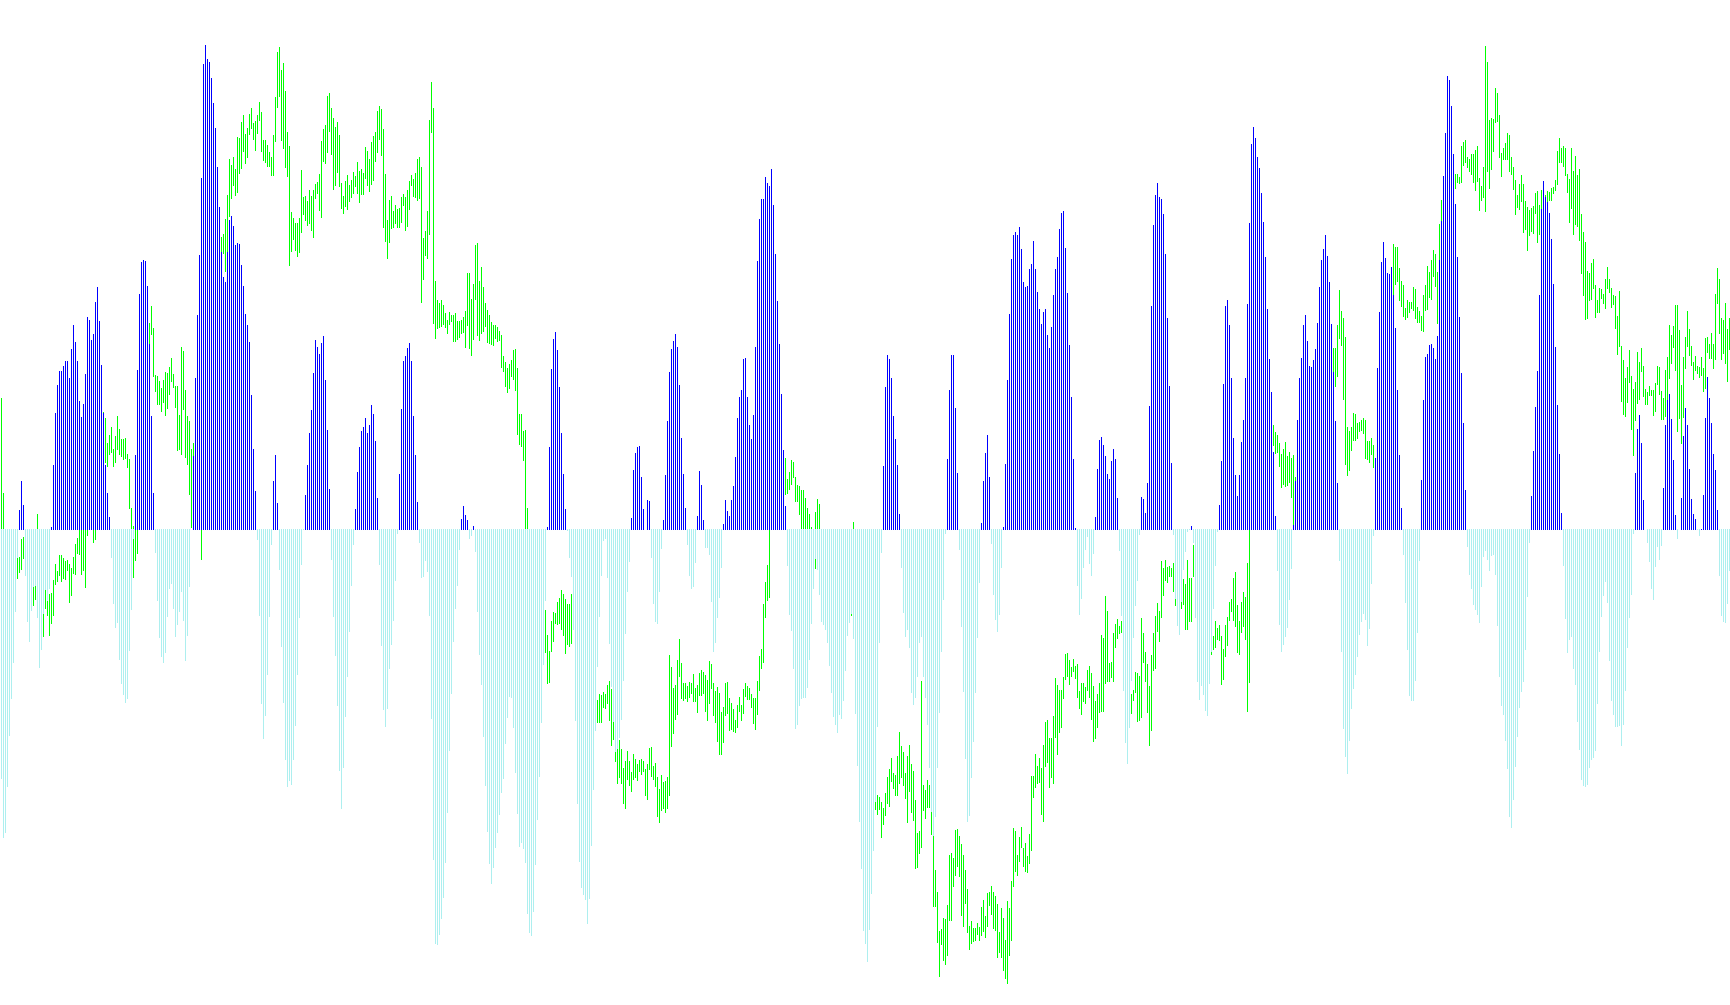
This tool is a specialized technical analysis indicator designed to help traders visualize price momentum and potential trend reversals by calculating the relative positioning of market prices.
Core Logic Overview
The script functions by analyzing price action over a specific, user-defined timeframe (the "period"). Instead of looking at raw price alone, it focuses on where the current price sits within a high-low range. It identifies the highest and lowest points reached during that period to establish a "boundary," then determines how close the current price is to the top or bottom of that boundary.
Data Processing Steps
- Relative Positioning: The script calculates a value based on where the middle of the current candle sits relative to the highest high and lowest low of the recent timeframe. This creates a normalized scale.
- Smoothing & Normalization: To prevent erratic jumps in data, the tool applies a weighted calculation. It blends the new price position with previous data points, ensuring the transition between movements is fluid rather than jagged. It also caps these values to stay within a specific range, preventing extreme outliers from distorting the visual output.
- Logarithmic Conversion: The script utilizes a logarithmic transformation on the smoothed value. This is a mathematical way to exaggerate the "acceleration" of price moves, making it easier for a trader to see when momentum is building rapidly or slowing down significantly.
- Trend Identification: Finally, the tool tracks the direction of this calculated momentum. It compares the current value against its predecessor to determine if the movement is climbing or falling.
Visual Representation
The indicator presents its findings in a separate window below the main price chart using two distinct colored histograms:
- Positive Momentum: When the calculation indicates upward pressure, one color (Lime) is displayed as a histogram.
- Negative Momentum: When the calculation indicates downward pressure, the opposite color (Red) is displayed.
By observing these shifting colors and the height of the bars, users can visually identify whether the market is currently leaning toward a bullish or bearish bias, helping to filter out minor "market noise" and focus on the underlying trend strength.
#property  copyright "Copyright © 2005, Yura Prokofiev"
#property  link      "Yura.prokofiev@gmail.com"

#property  indicator_separate_window
#property  indicator_buffers 3
#property  indicator_color2  Lime
#property  indicator_color3  Red
#property indicator_style2 STYLE_SOLID
#property indicator_style3 STYLE_SOLID
#property indicator_width2 3
#property indicator_width3 3
extern int period=10;

double         ExtBuffer0[];
double         ExtBuffer1[];
double         ExtBuffer2[];


int init()
  {

   SetIndexStyle(0,DRAW_NONE);
   SetIndexStyle(1,DRAW_HISTOGRAM);
   SetIndexStyle(2,DRAW_HISTOGRAM);
   IndicatorDigits(Digits+1);

   SetIndexBuffer(0,ExtBuffer0);
   SetIndexBuffer(1,ExtBuffer1);
   SetIndexBuffer(2,ExtBuffer2);

   IndicatorShortName("Fisher_Yur4ik");
   SetIndexLabel(1,NULL);
   SetIndexLabel(2,NULL);

   return(0);
  }


int start()
  {
   //int     period=10;
   int    limit;
   int    counted_bars=IndicatorCounted();
   double prev,current,old;
   double Value=0,Value1=0,Value2=0,Fish=0,Fish1=0,Fish2=0;
   double price;
   double MinL=0;
   double MaxH=0;


   if(counted_bars>0) counted_bars--;
   limit=Bars-counted_bars;


   for(int i=0; i<Bars; i++)
    {
      MaxH = High[Highest(NULL,0,MODE_HIGH,period,i)];
      MinL = Low[Lowest(NULL,0,MODE_LOW,period,i)];
      price = (High[i]+Low[i])/2;

      if(MaxH-MinL == 0) Value = 0.33*2*(0-0.5) + 0.67*Value1;
      else Value = 0.33*2*((price-MinL)/(MaxH-MinL)-0.5) + 0.67*Value1;

      Value=MathMin(MathMax(Value,-0.999),0.999);

      if(1-Value == 0) ExtBuffer0[i]=0.5+0.5*Fish1;
      else ExtBuffer0[i]=0.5*MathLog((1+Value)/(1-Value))+0.5*Fish1;

      Value1=Value;
      Fish1=ExtBuffer0[i];
    }


   bool up=true;
   for(i=Bars; i>=0; i--)
     {
      current=ExtBuffer0[i];
      prev=ExtBuffer0[i+1];

      if (((current<0)&&(prev>0))||(current<0))   up= false;
      if (((current>0)&&(prev<0))||(current>0))   up= true;

      if(!up)
        {
         ExtBuffer2[i]=current;
         ExtBuffer1[i]=0.0;
        }

       else
         {
          ExtBuffer1[i]=current;
          ExtBuffer2[i]=0.0;
         }
     }

   return(0);
  }
Comments